Computing
Computing's role in Physics 411
Time series analysis is heavily computational. There are some theoretical concepts to understand, but even these benefit from application or statistical testing using the computer. Therefore a large amount of your time will be spent analyzing either real or simulated data.
All of you are expected to have taken a first-year computer science class. Beyond that, student experience varies widely at UVic Physics, with some students having taken more formal computer training, others having worked in a co-op position that gave you experience with computational data analysis. The upshot is that the computing component of the course will be a lot harder for some students than others. Fortunately, there are lots of online resources to help. I use google pretty steadily while working on coding problems. Computing in this course will be from a strictly practical point of view, so there is no grading for quality of code (unless it doesn't work!).
Computing Advice
Data analysis:
You need a computing package that can analyze data sets. It should include:
- canned routines for handling matrices and linear algebra. You don't want to code the inversion of a matrix from scratch.
- data parsers for text. You don't want to write these if you can help it.
- a graphics library capable of making line plots, contour plots, and pseudo color images. You really don't want to write these!
For this class, I strongly recommend Python, with the iPython interface, the numpy and scipy data analysis packages, and the matplotlib graphics library. There are lots of other python libraries, but these ones are the core of the so-called "Python science stack".
Alternatives include
There are likely similar packages for Fortran, C, and other low-level compiled languages. I do not recommend these, as compiled languages are not as easy to interact with as interpreted languages. Python or matlab will allow you to process code step by step, check status temporarily by plotting or printing your data, and are much more convenient to debug code with.
Matlab is available on campus, and there are student licenses available. I don't supply advice on installing it, but many students have done it.
Data Presentation
For the homework's, you can either
- hand in a link to your iPython notebook,
- hand in a PDF of your work.
For the final project, you must present your work as a PDF. You should try to make the document in whatever document preparation software you are the most familiar with, but it should allow
- equations
- captions for figures
I typically use LaTeX. You may be more familiar with Word.
Using the Python Stack
Here you have three alternatives.
The first is to do the computing in the cloud using Wakari. Wakari will give you a full iPython environment, including iPython Notebook. Much of the the course materials are written as iPython Notebooks, and using Notebooks to do your assignments will be the most efficient way to do your homework. I'll give a step-by-step guide to Wakari below.
The second is very similar to the first, and it is to try cloud.sagemath.com. It works much the same as Wakari.
The other alternative is to install python and iPython on your own computer. I strongly recommend using the Anaconda distribution. Download the install to your machine, and run the commands. It will install all the python libraries needed in this course, and it is how I install python on my computers.
My notebooks are compatible with ipython version 4.0.0.
My recommendation If at all possible, install on your own computer. I've had trouble getting access to Wakari with a free account. Sometimes they simply don't have the resources to give you a login. That said, you can pay $10/month for a heightened- access account, which hopefully gives you higher priority to the CPUs, and is a lot less grief than dealing with an old laptop, etc. Sagemath looks great, but it has a pretty laggy interface which may be an annoyance after a while. However, once your notebook is open it seems to be fast enough.
I do not recommend trying to install python and all the libraries yourself by hand. It is a lot of work, and two years ago when I taught this course caused a lot of grief.
Wakari How-To
The Wakari people have a nice video: https://www.youtube.com/
- Go to http://www.wakari.io, and "Create an Account"
- When you go into Wakari, read the test document they give you
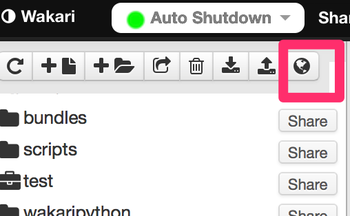
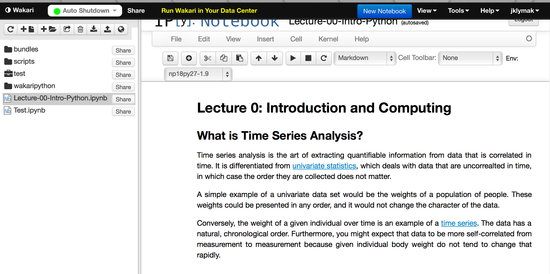
01_notebook_introduction. It is a good introduction to how python notebooks work. - To download a notebook from my website you would go to the icon that looks like the earth to upload the notebook.

- When it asks you for a URL, you could put in:
https://raw.githubusercontent.com/jklymak/Phy411/master/lectures/Lecture-00-Intro-Python.ipynb=You should then have the notebook in your directory:
- Ideally, you will organize your files a bit. You can use the interface on the left to make folders (i.e.
lectures,assignments,finalproject) - The best thing is that you can modify the Notebook you just downloaded (as opposed to the static view here). For example, in the "cell" under "Illustrative examples" you could change the line that reads:
ax1.plot(time,y2,label='$y_2$')to readax1.plot(time,y2,label='$y_2$',color='r'). Hitting shift-Enter will re-execute the "cell", and the color of the plot below the code should change to red. - When you are done editing the notebook, you can "save" it.
- If you want to share the notebook, i.e. with your professor, or other students, you just hit the "Share" button in the left hand panel, and follow the instructions to get a link to the notebook.
Your Own Computer How-To
If you want to use your own computer, I still recommend using iPython Notebooks. This requires running some commands in the command window.
- In the terminal, go to the directory with the notebooks you want to work on (or an empty directory). On most systems this is accomplished with the
cd MyDirectorycommand. - run
ipython notebookIf you have set everything up properly using anaconda, Firefox or another browser should open with a list of iPython notebooks. NOTE I've had trouble if OS-X's Safari opens. It has some incompatibilities with the graphics in the notebook, so if Safari opens, simply cut and paste the url into Firefox and run from there. - If you want to get your assignment, you can go to github: https://github.com/jklymak/Phy411/, navigate to
assignments, openAssignment-01.ipynb, and then right-click on theRawbutton and "Download Linked File As.." to save to your machine. Then you can open the notebook by runningipython notebookin the directory that you put the file in. - If you want to get fancy:
a. if you have wget on your machine, you can do:
wget https://github.com/jklymak/Phy411/raw/master/assigments/Assignment-01.ipynb
b. Or if you have curl:
curl -L "https://github.com/jklymak/Phy411/raw/masterassigments/Assignment-01.ipynb" > Assignment-01.ipynb