matplotlib.axes.Axes.axhline
-
Axes.axhline(self, y=0, xmin=0, xmax=1, **kwargs)[source]¶ Add a horizontal line across the axis.
Parameters: - yfloat, default: 0
y position in data coordinates of the horizontal line.
- xminfloat, default: 0
Should be between 0 and 1, 0 being the far left of the plot, 1 the far right of the plot.
- xmaxfloat, default: 1
Should be between 0 and 1, 0 being the far left of the plot, 1 the far right of the plot.
Returns: Other Parameters: - **kwargs
Valid keyword arguments are
Line2Dproperties, with the exception of 'transform':Property Description agg_filtera filter function, which takes a (m, n, 3) float array and a dpi value, and returns a (m, n, 3) array alphafloat or None animatedbool antialiasedor aabool clip_boxBboxclip_onbool clip_pathPatch or (Path, Transform) or None coloror ccolor containsunknown dash_capstyle{'butt', 'round', 'projecting'} dash_joinstyle{'miter', 'round', 'bevel'} dashessequence of floats (on/off ink in points) or (None, None) data(2, N) array or two 1D arrays drawstyleor ds{'default', 'steps', 'steps-pre', 'steps-mid', 'steps-post'}, default: 'default' figureFigurefillstyle{'full', 'left', 'right', 'bottom', 'top', 'none'} gidstr in_layoutbool labelobject linestyleor ls{'-', '--', '-.', ':', '', (offset, on-off-seq), ...} linewidthor lwfloat markermarker style string, PathorMarkerStylemarkeredgecoloror meccolor markeredgewidthor mewfloat markerfacecoloror mfccolor markerfacecoloraltor mfcaltcolor markersizeor msfloat markeveryNone or int or (int, int) or slice or List[int] or float or (float, float) or List[bool] path_effectsAbstractPathEffectpickerunknown pickradiusfloat rasterizedbool or None sketch_params(scale: float, length: float, randomness: float) snapbool or None solid_capstyle{'butt', 'round', 'projecting'} solid_joinstyle{'miter', 'round', 'bevel'} transformmatplotlib.transforms.Transformurlstr visiblebool xdata1D array ydata1D array zorderfloat
See also
Examples
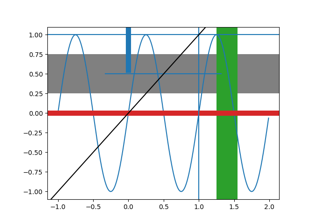
draw a thick red hline at 'y' = 0 that spans the xrange:
>>> axhline(linewidth=4, color='r')
draw a default hline at 'y' = 1 that spans the xrange:
>>> axhline(y=1)
draw a default hline at 'y' = .5 that spans the middle half of the xrange:
>>> axhline(y=.5, xmin=0.25, xmax=0.75)