matplotlib.axes.Axes.matshow
-
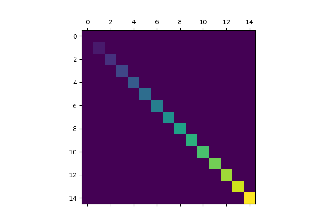
Axes.matshow(self, Z, **kwargs)[source]¶ Plot the values of a 2D matrix or array as color-coded image.
The matrix will be shown the way it would be printed, with the first row at the top. Row and column numbering is zero-based.
Parameters: - Zarray-like(M, N)
The matrix to be displayed.
Returns: Other Parameters: - **kwargs
imshowarguments
See also
imshow- More general function to plot data on a 2D regular raster.
Notes
This is just a convenience function wrapping
imshowto set useful defaults for displaying a matrix. In particular:- Set
origin='upper'. - Set
interpolation='nearest'. - Set
aspect='equal'. - Ticks are placed to the left and above.
- Ticks are formatted to show integer indices.