matplotlib.axes.Axes.pcolorfast
-
Axes.pcolorfast(self, *args, alpha=None, norm=None, cmap=None, vmin=None, vmax=None, data=None, **kwargs)[source]¶ Create a pseudocolor plot with a non-regular rectangular grid.
Call signature:
ax.pcolorfast([X, Y], C, /, **kwargs)
This method is similar to
pcolorandpcolormesh. It's designed to provide the fastest pcolor-type plotting with the Agg backend. To achieve this, it uses different algorithms internally depending on the complexity of the input grid (regular rectangular, non-regular rectangular or arbitrary quadrilateral).Warning
This method is experimental. Compared to
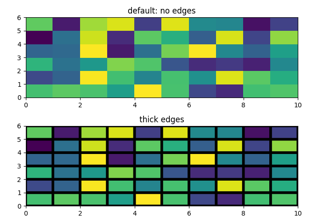
pcolororpcolormeshit has some limitations:- It supports only flat shading (no outlines)
- It lacks support for log scaling of the axes.
- It does not have a have a pyplot wrapper.
Parameters: - Carray-like(M, N)
The image data. Supported array shapes are:
- (M, N): an image with scalar data. The data is visualized using a colormap.
- (M, N, 3): an image with RGB values (0-1 float or 0-255 int).
- (M, N, 4): an image with RGBA values (0-1 float or 0-255 int), i.e. including transparency.
The first two dimensions (M, N) define the rows and columns of the image.
This parameter can only be passed positionally.
- X, Ytuple or array-like, default:
(0, N),(0, M) X and Y are used to specify the coordinates of the quadrilaterals. There are different ways to do this:
Use tuples
X=(xmin, xmax)andY=(ymin, ymax)to define a uniform rectangular grid.The tuples define the outer edges of the grid. All individual quadrilaterals will be of the same size. This is the fastest version.
Use 1D arrays X, Y to specify a non-uniform rectangular grid.
In this case X and Y have to be monotonic 1D arrays of length N+1 and M+1, specifying the x and y boundaries of the cells.
The speed is intermediate. Note: The grid is checked, and if found to be uniform the fast version is used.
Use 2D arrays X, Y if you need an arbitrary quadrilateral grid (i.e. if the quadrilaterals are not rectangular).
In this case X and Y are 2D arrays with shape (M + 1, N + 1), specifying the x and y coordinates of the corners of the colored quadrilaterals.
This is the most general, but the slowest to render. It may produce faster and more compact output using ps, pdf, and svg backends, however.
These arguments can only be passed positionally.
- cmapstr or
Colormap, default:rcParams["image.cmap"](default:'viridis') A Colormap instance or registered colormap name. The colormap maps the C values to colors.
- norm
Normalize, optional The Normalize instance scales the data values to the canonical colormap range [0, 1] for mapping to colors. By default, the data range is mapped to the colorbar range using linear scaling.
- vmin, vmaxfloat, default: None
The colorbar range. If None, suitable min/max values are automatically chosen by the
Normalizeinstance (defaults to the respective min/max values of C in case of the default linear scaling). It is deprecated to use vmin/vmax when norm is given.- alphafloat, default: None
The alpha blending value, between 0 (transparent) and 1 (opaque).
- snapbool, default: False
Whether to snap the mesh to pixel boundaries.
Returns: AxesImageorPcolorImageorQuadMeshThe return type depends on the type of grid:
AxesImagefor a regular rectangular grid.PcolorImagefor a non-regular rectangular grid.QuadMeshfor a non-rectangular grid.
Other Parameters: - **kwargs
Supported additional parameters depend on the type of grid. See return types of image for further description.
Notes
Note
In addition to the above described arguments, this function can take a data keyword argument. If such a data argument is given, every other argument can also be string
s, which is interpreted asdata[s](unless this raises an exception).Objects passed as data must support item access (
data[s]) and membership test (s in data).
