matplotlib.axes.Axes.plot_date
-
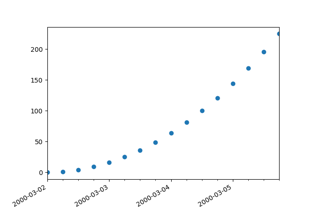
Axes.plot_date(self, x, y, fmt='o', tz=None, xdate=True, ydate=False, *, data=None, **kwargs)[source]¶ Plot data that contains dates.
Similar to
plot, this plots y vs. x as lines or markers. However, the axis labels are formatted as dates depending on xdate and ydate.Parameters: - x, yarray-like
The coordinates of the data points. If xdate or ydate is True, the respective values x or y are interpreted as Matplotlib dates.
- fmtstr, optional
The plot format string. For details, see the corresponding parameter in
plot.- tztimezone string or
datetime.tzinfo, default:rcParams["timezone"](default:'UTC') The time zone to use in labeling dates.
- xdatebool, default: True
If True, the x-axis will be interpreted as Matplotlib dates.
- ydatebool, default: False
If True, the y-axis will be interpreted as Matplotlib dates.
Returns: - lines
A list of
Line2Dobjects representing the plotted data.
Other Parameters: - **kwargs
Keyword arguments control the
Line2Dproperties:Property Description agg_filtera filter function, which takes a (m, n, 3) float array and a dpi value, and returns a (m, n, 3) array alphafloat or None animatedbool antialiasedor aabool clip_boxBboxclip_onbool clip_pathPatch or (Path, Transform) or None coloror ccolor containsunknown dash_capstyle{'butt', 'round', 'projecting'} dash_joinstyle{'miter', 'round', 'bevel'} dashessequence of floats (on/off ink in points) or (None, None) data(2, N) array or two 1D arrays drawstyleor ds{'default', 'steps', 'steps-pre', 'steps-mid', 'steps-post'}, default: 'default' figureFigurefillstyle{'full', 'left', 'right', 'bottom', 'top', 'none'} gidstr in_layoutbool labelobject linestyleor ls{'-', '--', '-.', ':', '', (offset, on-off-seq), ...} linewidthor lwfloat markermarker style string, PathorMarkerStylemarkeredgecoloror meccolor markeredgewidthor mewfloat markerfacecoloror mfccolor markerfacecoloraltor mfcaltcolor markersizeor msfloat markeveryNone or int or (int, int) or slice or List[int] or float or (float, float) or List[bool] path_effectsAbstractPathEffectpickerunknown pickradiusfloat rasterizedbool or None sketch_params(scale: float, length: float, randomness: float) snapbool or None solid_capstyle{'butt', 'round', 'projecting'} solid_joinstyle{'miter', 'round', 'bevel'} transformmatplotlib.transforms.Transformurlstr visiblebool xdata1D array ydata1D array zorderfloat
See also
matplotlib.dates- Helper functions on dates.
matplotlib.dates.date2num- Convert dates to num.
matplotlib.dates.num2date- Convert num to dates.
matplotlib.dates.drange- Create an equally spaced sequence of dates.
Notes
If you are using custom date tickers and formatters, it may be necessary to set the formatters/locators after the call to
plot_date.plot_datewill set the default tick locator toAutoDateLocator(if the tick locator is not already set to aDateLocatorinstance) and the default tick formatter toAutoDateFormatter(if the tick formatter is not already set to aDateFormatterinstance).Note
In addition to the above described arguments, this function can take a data keyword argument. If such a data argument is given, the following arguments can also be string
s, which is interpreted asdata[s](unless this raises an exception): x, y.Objects passed as data must support item access (
data[s]) and membership test (s in data).