matplotlib.patches.Rectangle
-
class
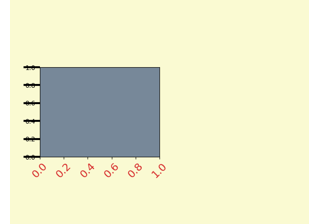
matplotlib.patches.Rectangle(xy, width, height, angle=0.0, **kwargs)[source]¶ Bases:
matplotlib.patches.PatchA rectangle defined via an anchor point xy and its width and height.
The rectangle extends from
xy[0]toxy[0] + widthin x-direction and fromxy[1]toxy[1] + heightin y-direction.: +------------------+ : | | : height | : | | : (xy)---- width -----+
One may picture xy as the bottom left corner, but which corner xy is actually depends on the the direction of the axis and the sign of width and height; e.g. xy would be the bottom right corner if the x-axis was inverted or if width was negative.
Parameters: - xy(float, float)
The anchor point.
- widthfloat
Rectangle width.
- heightfloat
Rectangle height.
- anglefloat, default: 0
Rotation in degrees anti-clockwise about xy.
Other Parameters: - **kwargs
Patchproperties Property Description agg_filtera filter function, which takes a (m, n, 3) float array and a dpi value, and returns a (m, n, 3) array alphafloat or None animatedbool antialiasedor aaunknown capstyle{'butt', 'round', 'projecting'} clip_boxBboxclip_onbool clip_pathPatch or (Path, Transform) or None colorcolor containsunknown edgecoloror eccolor or None or 'auto' facecoloror fccolor or None figureFigurefillbool gidstr hatch{'/', '\', '|', '-', '+', 'x', 'o', 'O', '.', '*'} in_layoutbool joinstyle{'miter', 'round', 'bevel'} labelobject linestyleor ls{'-', '--', '-.', ':', '', (offset, on-off-seq), ...} linewidthor lwfloat or None path_effectsAbstractPathEffectpickerNone or bool or callable rasterizedbool or None sketch_params(scale: float, length: float, randomness: float) snapbool or None transformTransformurlstr visiblebool zorderfloat
-
__init__(self, xy, width, height, angle=0.0, **kwargs)[source]¶ Parameters: - xy(float, float)
The anchor point.
- widthfloat
Rectangle width.
- heightfloat
Rectangle height.
- anglefloat, default: 0
Rotation in degrees anti-clockwise about xy.
Other Parameters: - **kwargs
Patchproperties Property Description agg_filtera filter function, which takes a (m, n, 3) float array and a dpi value, and returns a (m, n, 3) array alphafloat or None animatedbool antialiasedor aaunknown capstyle{'butt', 'round', 'projecting'} clip_boxBboxclip_onbool clip_pathPatch or (Path, Transform) or None colorcolor containsunknown edgecoloror eccolor or None or 'auto' facecoloror fccolor or None figureFigurefillbool gidstr hatch{'/', '\', '|', '-', '+', 'x', 'o', 'O', '.', '*'} in_layoutbool joinstyle{'miter', 'round', 'bevel'} labelobject linestyleor ls{'-', '--', '-.', ':', '', (offset, on-off-seq), ...} linewidthor lwfloat or None path_effectsAbstractPathEffectpickerNone or bool or callable rasterizedbool or None sketch_params(scale: float, length: float, randomness: float) snapbool or None transformTransformurlstr visiblebool zorderfloat
-
__module__= 'matplotlib.patches'
-
get_patch_transform(self)[source]¶ Return the
Transforminstance mapping patch coordinates to data coordinates.For example, one may define a patch of a circle which represents a radius of 5 by providing coordinates for a unit circle, and a transform which scales the coordinates (the patch coordinate) by 5.
-
set_bounds(self, *args)[source]¶ Set the bounds of the rectangle as left, bottom, width, height.
The values may be passed as separate parameters or as a tuple:
set_bounds(left, bottom, width, height)
set_bounds((left, bottom, width, height))
-
set_xy(self, xy)[source]¶ Set the left and bottom coordinates of the rectangle.
Parameters: - xy(float, float)
-
property
xy¶ Return the left and bottom coords of the rectangle as a tuple.