matplotlib.pyplot.subplot2grid
-
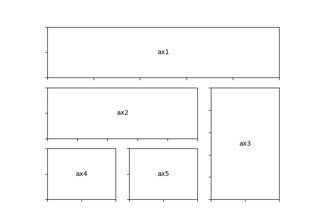
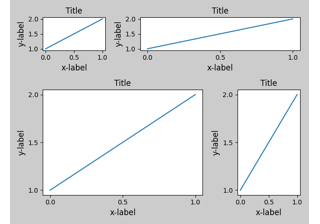
matplotlib.pyplot.subplot2grid(shape, loc, rowspan=1, colspan=1, fig=None, **kwargs)[source]¶ Create a subplot at a specific location inside a regular grid.
Parameters: - shape(int, int)
Number of rows and of columns of the grid in which to place axis.
- loc(int, int)
Row number and column number of the axis location within the grid.
- rowspanint, default: 1
Number of rows for the axis to span to the right.
- colspanint, default: 1
Number of columns for the axis to span downwards.
- fig
Figure, optional Figure to place the subplot in. Defaults to the current figure.
- **kwargs
Additional keyword arguments are handed to
add_subplot.
Returns: axes.SubplotBase, or another subclass ofAxesThe axes of the subplot. The returned axes base class depends on the projection used. It is
Axesif rectilinear projection is used andprojections.polar.PolarAxesif polar projection is used. The returned axes is then a subplot subclass of the base class.
Notes
The following call
ax = subplot2grid((nrows, ncols), (row, col), rowspan, colspan)
is identical to
fig = gcf()
gs = fig.add_gridspec(nrows, ncols)
ax = fig.add_subplot(gs[row:row+rowspan, col:col+colspan])