Note
Click here to download the full example code
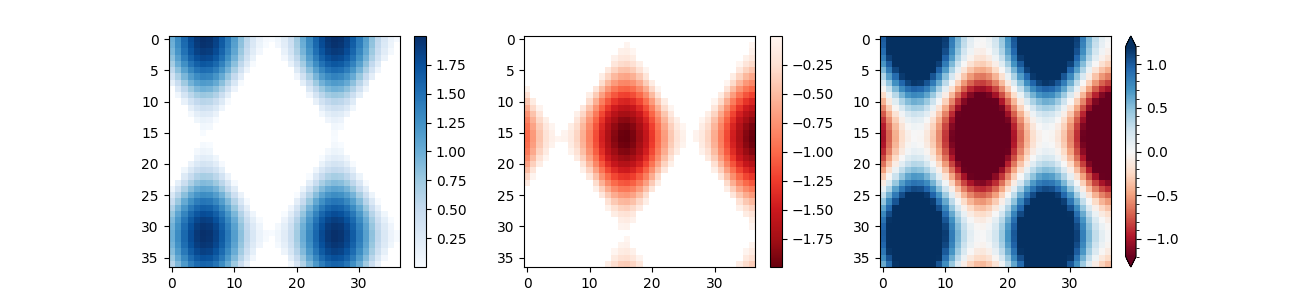
Colorbar
Use colorbar by specifying the mappable object (here
the AxesImage returned by imshow)
and the axes to attach the colorbar to.
import numpy as np
import matplotlib.pyplot as plt

# setup some generic data
N = 37
x, y = np.mgrid[:N, :N]
Z = (np.cos(x*0.2) + np.sin(y*0.3))

# mask out the negative and positive values, respectively
Zpos = np.ma.masked_less(Z, 0)
Zneg = np.ma.masked_greater(Z, 0)

fig, (ax1, ax2, ax3) = plt.subplots(figsize=(13, 3), ncols=3)

# plot just the positive data and save the
# color "mappable" object returned by ax1.imshow
pos = ax1.imshow(Zpos, cmap='Blues', interpolation='none')

# add the colorbar using the figure's method,
# telling which mappable we're talking about and
# which axes object it should be near
fig.colorbar(pos, ax=ax1)

# repeat everything above for the negative data
neg = ax2.imshow(Zneg, cmap='Reds_r', interpolation='none')
fig.colorbar(neg, ax=ax2)

# Plot both positive and negative values between +/- 1.2
pos_neg_clipped = ax3.imshow(Z, cmap='RdBu', vmin=-1.2, vmax=1.2,
                             interpolation='none')
# Add minorticks on the colorbar to make it easy to read the
# values off the colorbar.
cbar = fig.colorbar(pos_neg_clipped, ax=ax3, extend='both')
cbar.minorticks_on()
plt.show()
References
The use of the following functions, methods, classes and modules is shown in this example:
import matplotlib
import matplotlib.colorbar
matplotlib.axes.Axes.imshow
matplotlib.pyplot.imshow
matplotlib.figure.Figure.colorbar
matplotlib.pyplot.colorbar
matplotlib.colorbar.Colorbar.minorticks_on
matplotlib.colorbar.Colorbar.minorticks_off
Out:
<function ColorbarBase.minorticks_off at 0x7fba55012670>
Keywords: matplotlib code example, codex, python plot, pyplot Gallery generated by Sphinx-Gallery