Note
Click here to download the full example code
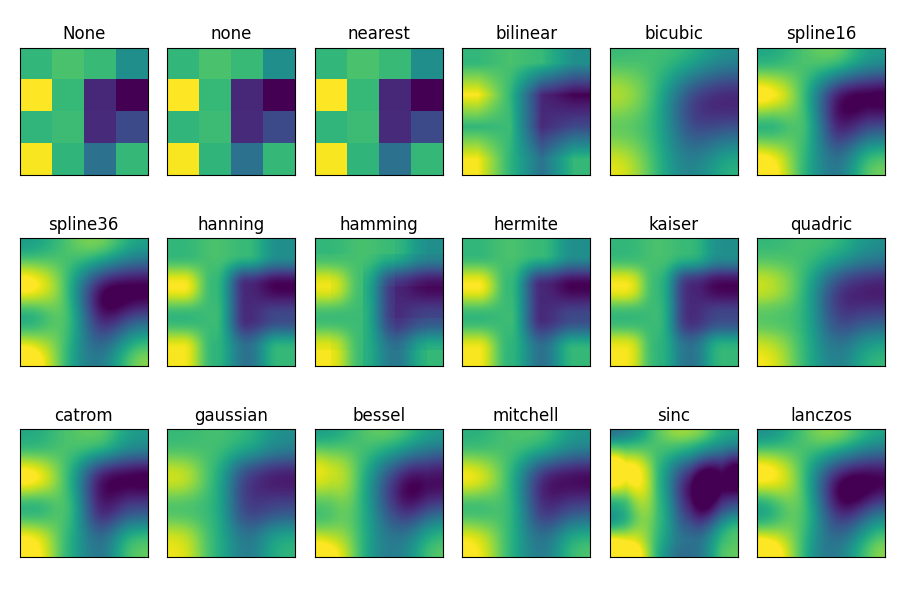
Interpolations for imshow
This example displays the difference between interpolation methods for
imshow.
If interpolation is None, it defaults to the rcParams["image.interpolation"] (default: 'antialiased').
If the interpolation is 'none', then no interpolation is performed for the
Agg, ps and pdf backends. Other backends will default to 'antialiased'.
For the Agg, ps and pdf backends, interpolation = 'none' works well when a
big image is scaled down, while interpolation = 'nearest' works well when
a small image is scaled up.
See Image antialiasing for a
discussion on the default interpolation="antialiased" option.
import matplotlib.pyplot as plt
import numpy as np

methods = [None, 'none', 'nearest', 'bilinear', 'bicubic', 'spline16',
           'spline36', 'hanning', 'hamming', 'hermite', 'kaiser', 'quadric',
           'catrom', 'gaussian', 'bessel', 'mitchell', 'sinc', 'lanczos']

# Fixing random state for reproducibility
np.random.seed(19680801)

grid = np.random.rand(4, 4)

fig, axs = plt.subplots(nrows=3, ncols=6, figsize=(9, 6),
                        subplot_kw={'xticks': [], 'yticks': []})

for ax, interp_method in zip(axs.flat, methods):
    ax.imshow(grid, interpolation=interp_method, cmap='viridis')
    ax.set_title(str(interp_method))

plt.tight_layout()
plt.show()
References
The use of the following functions and methods is shown in this example:
import matplotlib
matplotlib.axes.Axes.imshow
matplotlib.pyplot.imshow
Out:
<function imshow at 0x7fba54a7a310>
Total running time of the script: ( 0 minutes 1.339 seconds)
Keywords: matplotlib code example, codex, python plot, pyplot Gallery generated by Sphinx-Gallery