Note
Click here to download the full example code
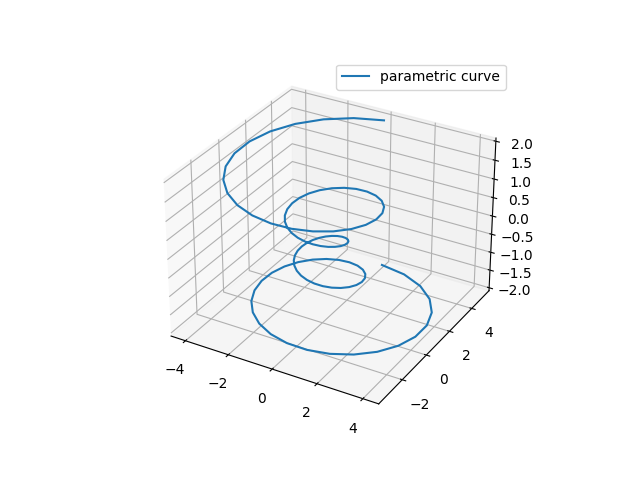
Parametric Curve
This example demonstrates plotting a parametric curve in 3D.
import numpy as np
import matplotlib.pyplot as plt


plt.rcParams['legend.fontsize'] = 10

fig = plt.figure()
ax = fig.gca(projection='3d')

# Prepare arrays x, y, z
theta = np.linspace(-4 * np.pi, 4 * np.pi, 100)
z = np.linspace(-2, 2, 100)
r = z**2 + 1
x = r * np.sin(theta)
y = r * np.cos(theta)

ax.plot(x, y, z, label='parametric curve')
ax.legend()

plt.show()
Keywords: matplotlib code example, codex, python plot, pyplot Gallery generated by Sphinx-Gallery