Note
Click here to download the full example code
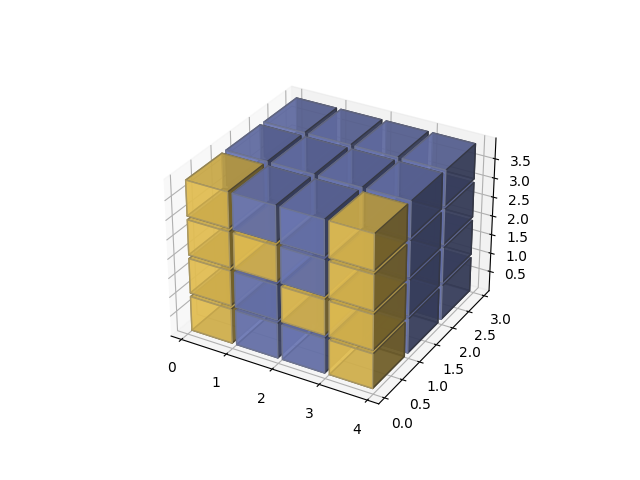
3D voxel plot of the numpy logo
Demonstrates using Axes3D.voxels with uneven coordinates.

import matplotlib.pyplot as plt
import numpy as np


def explode(data):
    size = np.array(data.shape)*2
    data_e = np.zeros(size - 1, dtype=data.dtype)
    data_e[::2, ::2, ::2] = data
    return data_e

# build up the numpy logo
n_voxels = np.zeros((4, 3, 4), dtype=bool)
n_voxels[0, 0, :] = True
n_voxels[-1, 0, :] = True
n_voxels[1, 0, 2] = True
n_voxels[2, 0, 1] = True
facecolors = np.where(n_voxels, '#FFD65DC0', '#7A88CCC0')
edgecolors = np.where(n_voxels, '#BFAB6E', '#7D84A6')
filled = np.ones(n_voxels.shape)

# upscale the above voxel image, leaving gaps
filled_2 = explode(filled)
fcolors_2 = explode(facecolors)
ecolors_2 = explode(edgecolors)

# Shrink the gaps
x, y, z = np.indices(np.array(filled_2.shape) + 1).astype(float) // 2
x[0::2, :, :] += 0.05
y[:, 0::2, :] += 0.05
z[:, :, 0::2] += 0.05
x[1::2, :, :] += 0.95
y[:, 1::2, :] += 0.95
z[:, :, 1::2] += 0.95

fig = plt.figure()
ax = fig.gca(projection='3d')
ax.voxels(x, y, z, filled_2, facecolors=fcolors_2, edgecolors=ecolors_2)

plt.show()
Keywords: matplotlib code example, codex, python plot, pyplot Gallery generated by Sphinx-Gallery