Note
Click here to download the full example code
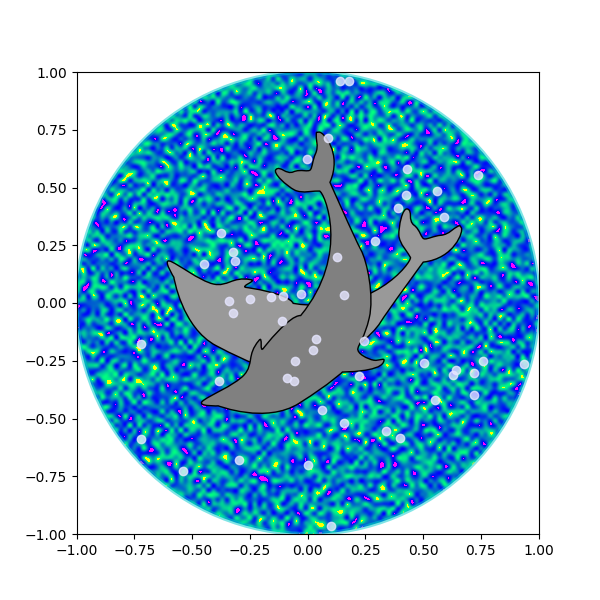
Dolphins
This example shows how to draw, and manipulate shapes given vertices
and nodes using the Path, PathPatch and
transforms classes.
import matplotlib.cm as cm
import matplotlib.pyplot as plt
from matplotlib.patches import Circle, PathPatch
from matplotlib.path import Path
from matplotlib.transforms import Affine2D
import numpy as np

# Fixing random state for reproducibility
np.random.seed(19680801)


r = np.random.rand(50)
t = np.random.rand(50) * np.pi * 2.0
x = r * np.cos(t)
y = r * np.sin(t)

fig, ax = plt.subplots(figsize=(6, 6))
circle = Circle((0, 0), 1, facecolor='none',
                edgecolor=(0, 0.8, 0.8), linewidth=3, alpha=0.5)
ax.add_patch(circle)

im = plt.imshow(np.random.random((100, 100)),
                origin='lower', cmap=cm.winter,
                interpolation='spline36',
                extent=([-1, 1, -1, 1]))
im.set_clip_path(circle)

plt.plot(x, y, 'o', color=(0.9, 0.9, 1.0), alpha=0.8)

# Dolphin from OpenClipart library by Andy Fitzsimon
#   <cc:License rdf:about="http://web.resource.org/cc/PublicDomain">
#     <cc:permits rdf:resource="http://web.resource.org/cc/Reproduction"/>
#     <cc:permits rdf:resource="http://web.resource.org/cc/Distribution"/>
#     <cc:permits rdf:resource="http://web.resource.org/cc/DerivativeWorks"/>
#   </cc:License>

dolphin = """
M -0.59739425,160.18173 C -0.62740401,160.18885 -0.57867129,160.11183
-0.57867129,160.11183 C -0.57867129,160.11183 -0.5438361,159.89315
-0.39514638,159.81496 C -0.24645668,159.73678 -0.18316813,159.71981
-0.18316813,159.71981 C -0.18316813,159.71981 -0.10322971,159.58124
-0.057804323,159.58725 C -0.029723983,159.58913 -0.061841603,159.60356
-0.071265813,159.62815 C -0.080250183,159.65325 -0.082918513,159.70554
-0.061841203,159.71248 C -0.040763903,159.7194 -0.0066711426,159.71091
0.077336307,159.73612 C 0.16879567,159.76377 0.28380306,159.86448
0.31516668,159.91533 C 0.3465303,159.96618 0.5011127,160.1771
0.5011127,160.1771 C 0.63668998,160.19238 0.67763022,160.31259
0.66556395,160.32668 C 0.65339985,160.34212 0.66350443,160.33642
0.64907098,160.33088 C 0.63463742,160.32533 0.61309688,160.297
0.5789627,160.29339 C 0.54348657,160.28968 0.52329693,160.27674
0.50728856,160.27737 C 0.49060916,160.27795 0.48965803,160.31565
0.46114204,160.33673 C 0.43329696,160.35786 0.4570711,160.39871
0.43309565,160.40685 C 0.4105108,160.41442 0.39416631,160.33027
0.3954995,160.2935 C 0.39683269,160.25672 0.43807996,160.21522
0.44567915,160.19734 C 0.45327833,160.17946 0.27946869,159.9424
-0.061852613,159.99845 C -0.083965233,160.0427 -0.26176109,160.06683
-0.26176109,160.06683 C -0.30127962,160.07028 -0.21167141,160.09731
-0.24649368,160.1011 C -0.32642366,160.11569 -0.34521187,160.06895
-0.40622293,160.0819 C -0.467234,160.09485 -0.56738444,160.17461
-0.59739425,160.18173
"""

vertices = []
codes = []
parts = dolphin.split()
i = 0
code_map = {
    'M': Path.MOVETO,
    'C': Path.CURVE4,
    'L': Path.LINETO,
}

while i < len(parts):
    path_code = code_map[parts[i]]
    npoints = Path.NUM_VERTICES_FOR_CODE[path_code]
    codes.extend([path_code] * npoints)
    vertices.extend([[*map(float, y.split(','))]
                     for y in parts[i + 1:][:npoints]])
    i += npoints + 1
vertices = np.array(vertices)
vertices[:, 1] -= 160

dolphin_path = Path(vertices, codes)
dolphin_patch = PathPatch(dolphin_path, facecolor=(0.6, 0.6, 0.6),
                          edgecolor=(0.0, 0.0, 0.0))
ax.add_patch(dolphin_patch)

vertices = Affine2D().rotate_deg(60).transform(vertices)
dolphin_path2 = Path(vertices, codes)
dolphin_patch2 = PathPatch(dolphin_path2, facecolor=(0.5, 0.5, 0.5),
                           edgecolor=(0.0, 0.0, 0.0))
ax.add_patch(dolphin_patch2)

plt.show()
References
The use of the following functions, methods, classes and modules is shown in this example:
Out:
<function Affine2D.rotate_deg at 0x7fba5531ae50>
Keywords: matplotlib code example, codex, python plot, pyplot Gallery generated by Sphinx-Gallery