Note
Click here to download the full example code
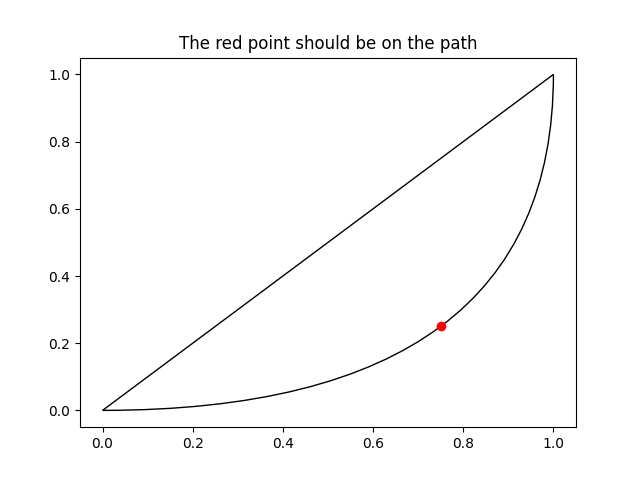
Bezier Curve
This example showcases the PathPatch object to create a Bezier
polycurve path patch.
import matplotlib.path as mpath
import matplotlib.patches as mpatches
import matplotlib.pyplot as plt

Path = mpath.Path

fig, ax = plt.subplots()
pp1 = mpatches.PathPatch(
    Path([(0, 0), (1, 0), (1, 1), (0, 0)],
         [Path.MOVETO, Path.CURVE3, Path.CURVE3, Path.CLOSEPOLY]),
    fc="none", transform=ax.transData)

ax.add_patch(pp1)
ax.plot([0.75], [0.25], "ro")
ax.set_title('The red point should be on the path')

plt.show()
References
The use of the following functions, methods, classes and modules is shown in this example:
Out:
<function _AxesBase.add_patch at 0x7fba54b30dc0>
Keywords: matplotlib code example, codex, python plot, pyplot Gallery generated by Sphinx-Gallery