Note
Click here to download the full example code
Axes box aspect
This demo shows how to set the aspect of an axes box directly via
set_box_aspect. The box aspect is the ratio between axes height
and axes width in physical units, independent of the data limits.
This is useful to e.g. produce a square plot, independent of the data it
contains, or to have a usual plot with the same axes dimensions next to
an image plot with fixed (data-)aspect.
The following lists a few use cases for set_box_aspect.
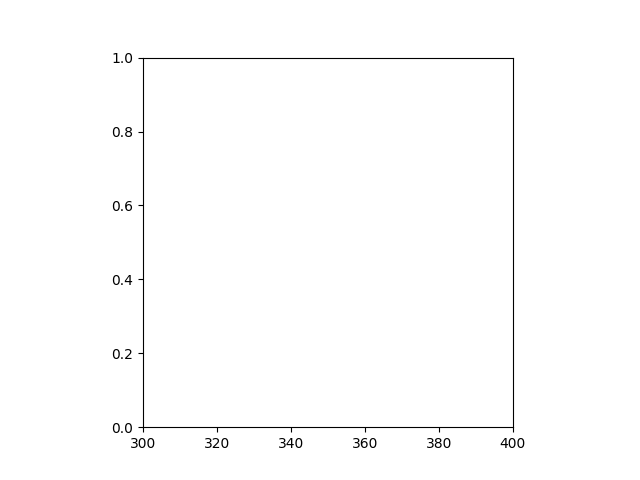
A square axes, independent of data
Produce a square axes, no matter what the data limits are.
import matplotlib
import numpy as np
import matplotlib.pyplot as plt

fig1, ax = plt.subplots()

ax.set_xlim(300, 400)
ax.set_box_aspect(1)

plt.show()
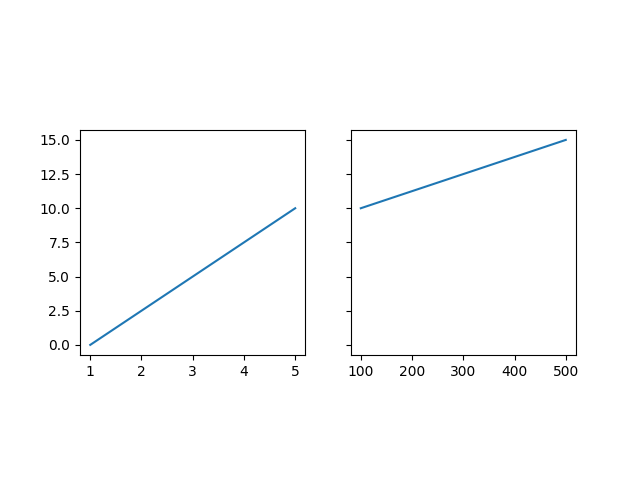
Shared square axes
Produce shared subplots that are squared in size.
fig2, (ax, ax2) = plt.subplots(ncols=2, sharey=True)

ax.plot([1, 5], [0, 10])
ax2.plot([100, 500], [10, 15])

ax.set_box_aspect(1)
ax2.set_box_aspect(1)

plt.show()
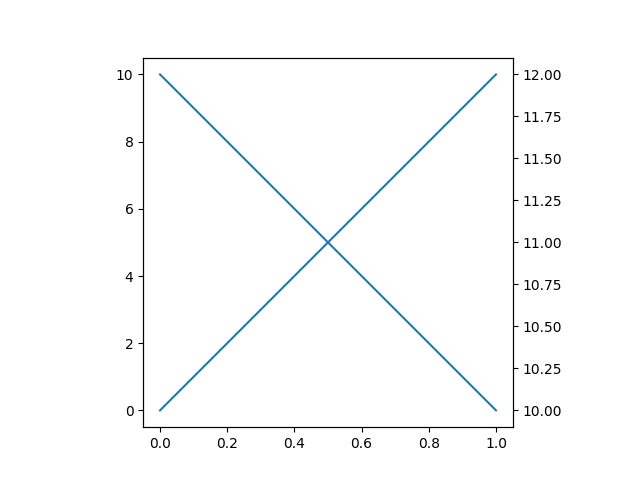
Square twin axes
Produce a square axes, with a twin axes. The twinned axes takes over the box aspect of the parent.
fig3, ax = plt.subplots()

ax2 = ax.twinx()

ax.plot([0, 10])
ax2.plot([12, 10])

ax.set_box_aspect(1)

plt.show()
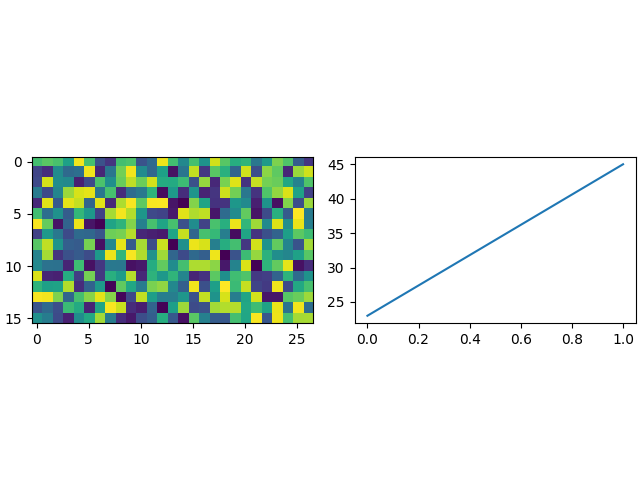
Normal plot next to image
When creating an image plot with fixed data aspect and the default
adjustable="box" next to a normal plot, the axes would be unequal in
height. set_box_aspect provides an easy solution to that by allowing
to have the normal plot's axes use the images dimensions as box aspect.
This example also shows that constrained_layout interplays nicely with
a fixed box aspect.
fig4, (ax, ax2) = plt.subplots(ncols=2, constrained_layout=True)

np.random.seed(19680801)  # Fixing random state for reproducibility
im = np.random.rand(16, 27)
ax.imshow(im)

ax2.plot([23, 45])
ax2.set_box_aspect(im.shape[0]/im.shape[1])

plt.show()
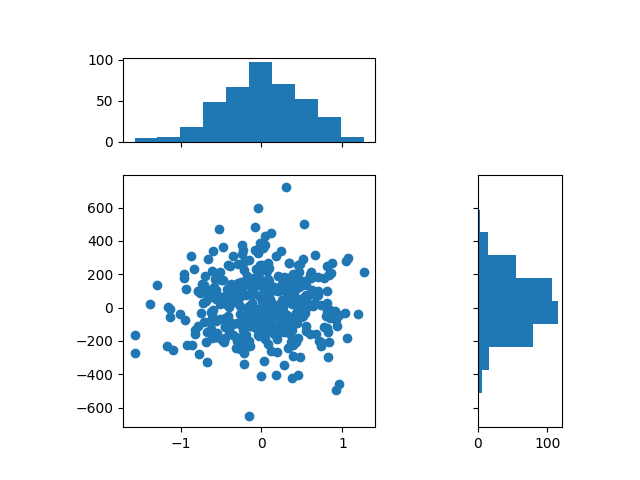
Square joint/marginal plot
It may be desirable to show marginal distributions next to a plot of joint data. The following creates a square plot with the box aspect of the marginal axes being equal to the width- and height-ratios of the gridspec. This ensures that all axes align perfectly, independent on the size of the figure.
fig5, axs = plt.subplots(2, 2, sharex="col", sharey="row",
                         gridspec_kw=dict(height_ratios=[1, 3],
                                          width_ratios=[3, 1]))
axs[0, 1].set_visible(False)
axs[0, 0].set_box_aspect(1/3)
axs[1, 0].set_box_aspect(1)
axs[1, 1].set_box_aspect(3/1)

np.random.seed(19680801)  # Fixing random state for reproducibility
x, y = np.random.randn(2, 400) * [[.5], [180]]
axs[1, 0].scatter(x, y)
axs[0, 0].hist(x)
axs[1, 1].hist(y, orientation="horizontal")

plt.show()
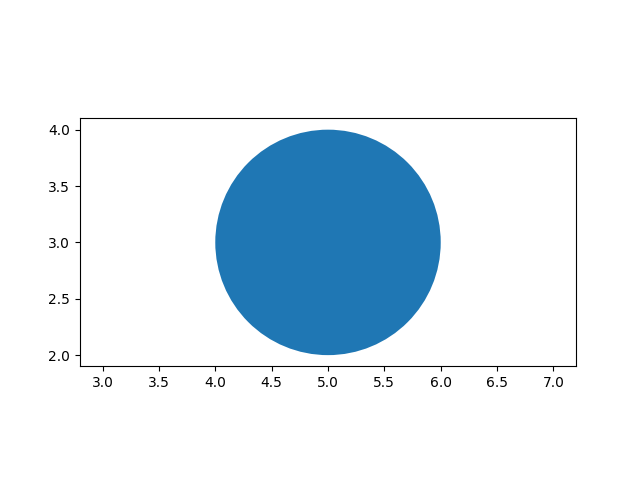
Square joint/marginal plot
When setting the box aspect, one may still set the data aspect as well. Here we create an axes with a box twice as long as tall and use an "equal" data aspect for its contents, i.e. the circle actually stays circular.
fig6, ax = plt.subplots()

ax.add_patch(plt.Circle((5, 3), 1))
ax.set_aspect("equal", adjustable="datalim")
ax.set_box_aspect(0.5)
ax.autoscale()

plt.show()
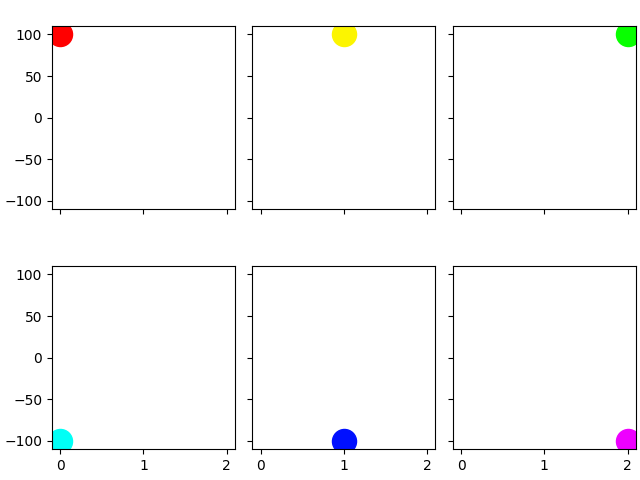
Box aspect for many subplots
It is possible to pass the box aspect to an axes at initialization. The following creates a 2 by 3 subplot grid with all square axes.
fig7, axs = plt.subplots(2, 3, subplot_kw=dict(box_aspect=1),
                         sharex=True, sharey=True, constrained_layout=True)

for i, ax in enumerate(axs.flat):
    ax.scatter(i % 3, -((i // 3) - 0.5)*200, c=[plt.cm.hsv(i / 6)], s=300)
plt.show()
References
The use of the following functions, methods and classes is shown in this example:
Out:
<function _AxesBase.set_box_aspect at 0x7fba54b30040>
Total running time of the script: ( 0 minutes 2.035 seconds)
Keywords: matplotlib code example, codex, python plot, pyplot Gallery generated by Sphinx-Gallery