Note
Click here to download the full example code
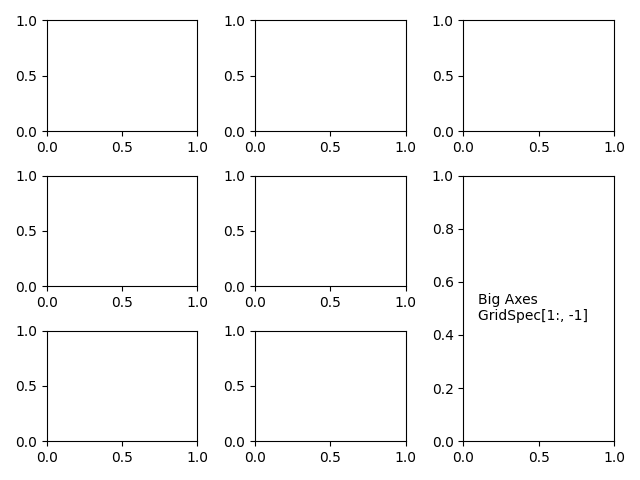
Combining two subplots using subplots and GridSpec
Sometimes we want to combine two subplots in an axes layout created with
subplots. We can get the GridSpec from the axes
and then remove the covered axes and fill the gap with a new bigger axes.
Here we create a layout with the bottom two axes in the last column combined.
See also Customizing Figure Layouts Using GridSpec and Other Functions.
import matplotlib.pyplot as plt

fig, axs = plt.subplots(ncols=3, nrows=3)
gs = axs[1, 2].get_gridspec()
# remove the underlying axes
for ax in axs[1:, -1]:
    ax.remove()
axbig = fig.add_subplot(gs[1:, -1])
axbig.annotate('Big Axes \nGridSpec[1:, -1]', (0.1, 0.5),
               xycoords='axes fraction', va='center')

fig.tight_layout()

plt.show()
Keywords: matplotlib code example, codex, python plot, pyplot Gallery generated by Sphinx-Gallery