Note
Click here to download the full example code
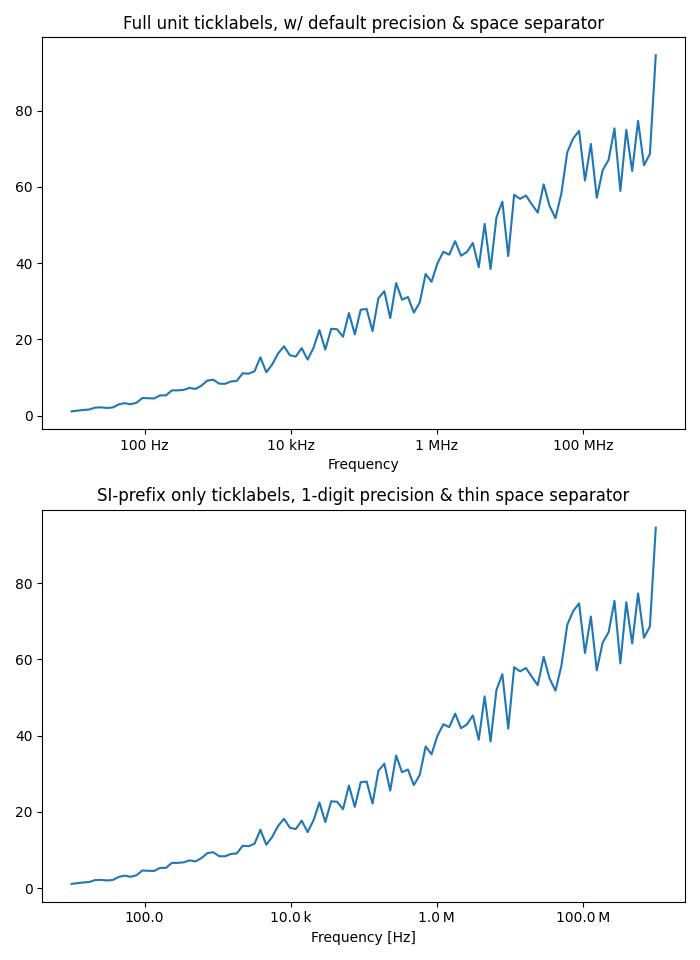
Labeling ticks using engineering notation
Use of the engineering Formatter.

import matplotlib.pyplot as plt
import numpy as np

from matplotlib.ticker import EngFormatter

# Fixing random state for reproducibility
prng = np.random.RandomState(19680801)

# Create artificial data to plot.
# The x data span over several decades to demonstrate several SI prefixes.
xs = np.logspace(1, 9, 100)
ys = (0.8 + 0.4 * prng.uniform(size=100)) * np.log10(xs)**2

# Figure width is doubled (2*6.4) to display nicely 2 subplots side by side.
fig, (ax0, ax1) = plt.subplots(nrows=2, figsize=(7, 9.6))
for ax in (ax0, ax1):
    ax.set_xscale('log')

# Demo of the default settings, with a user-defined unit label.
ax0.set_title('Full unit ticklabels, w/ default precision & space separator')
formatter0 = EngFormatter(unit='Hz')
ax0.xaxis.set_major_formatter(formatter0)
ax0.plot(xs, ys)
ax0.set_xlabel('Frequency')

# Demo of the options `places` (number of digit after decimal point) and
# `sep` (separator between the number and the prefix/unit).
ax1.set_title('SI-prefix only ticklabels, 1-digit precision & '
              'thin space separator')
formatter1 = EngFormatter(places=1, sep="\N{THIN SPACE}")  # U+2009
ax1.xaxis.set_major_formatter(formatter1)
ax1.plot(xs, ys)
ax1.set_xlabel('Frequency [Hz]')

plt.tight_layout()
plt.show()
Keywords: matplotlib code example, codex, python plot, pyplot Gallery generated by Sphinx-Gallery