Note
Click here to download the full example code
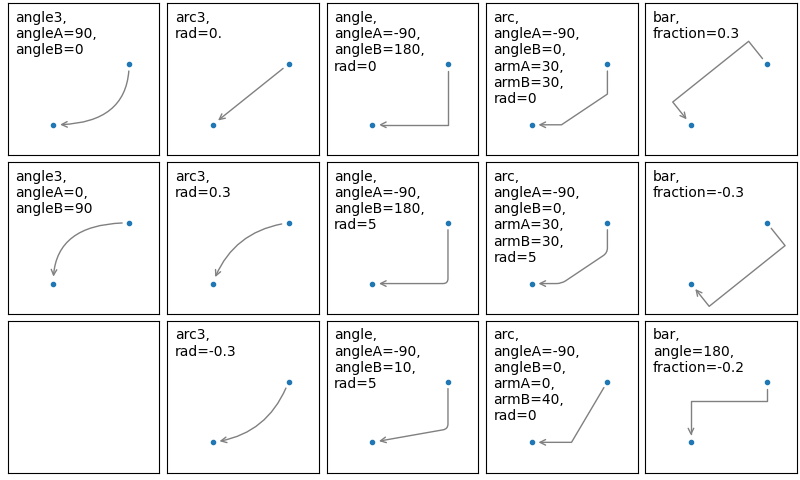
Connectionstyle Demo
When creating an annotation using annotate, the arrow shape can be
controlled via the connectionstyle parameter of arrowprops. For further
details see the description of FancyArrowPatch.
import matplotlib.pyplot as plt


def demo_con_style(ax, connectionstyle):
    x1, y1 = 0.3, 0.2
    x2, y2 = 0.8, 0.6

    ax.plot([x1, x2], [y1, y2], ".")
    ax.annotate("",
                xy=(x1, y1), xycoords='data',
                xytext=(x2, y2), textcoords='data',
                arrowprops=dict(arrowstyle="->", color="0.5",
                                shrinkA=5, shrinkB=5,
                                patchA=None, patchB=None,
                                connectionstyle=connectionstyle,
                                ),
                )

    ax.text(.05, .95, connectionstyle.replace(",", ",\n"),
            transform=ax.transAxes, ha="left", va="top")


fig, axs = plt.subplots(3, 5, figsize=(8, 4.8))
demo_con_style(axs[0, 0], "angle3,angleA=90,angleB=0")
demo_con_style(axs[1, 0], "angle3,angleA=0,angleB=90")
demo_con_style(axs[0, 1], "arc3,rad=0.")
demo_con_style(axs[1, 1], "arc3,rad=0.3")
demo_con_style(axs[2, 1], "arc3,rad=-0.3")
demo_con_style(axs[0, 2], "angle,angleA=-90,angleB=180,rad=0")
demo_con_style(axs[1, 2], "angle,angleA=-90,angleB=180,rad=5")
demo_con_style(axs[2, 2], "angle,angleA=-90,angleB=10,rad=5")
demo_con_style(axs[0, 3], "arc,angleA=-90,angleB=0,armA=30,armB=30,rad=0")
demo_con_style(axs[1, 3], "arc,angleA=-90,angleB=0,armA=30,armB=30,rad=5")
demo_con_style(axs[2, 3], "arc,angleA=-90,angleB=0,armA=0,armB=40,rad=0")
demo_con_style(axs[0, 4], "bar,fraction=0.3")
demo_con_style(axs[1, 4], "bar,fraction=-0.3")
demo_con_style(axs[2, 4], "bar,angle=180,fraction=-0.2")

for ax in axs.flat:
    ax.set(xlim=(0, 1), ylim=(0, 1), xticks=[], yticks=[], aspect=1)
fig.tight_layout(pad=0.2)

plt.show()
References
The use of the following functions, methods, classes and modules is shown in this example:
import matplotlib
matplotlib.axes.Axes.annotate
matplotlib.patches.FancyArrowPatch
Keywords: matplotlib code example, codex, python plot, pyplot Gallery generated by Sphinx-Gallery