matplotlib.axes
matplotlib.axes.Axes.add_patch
Axes.
add_patch
Add a Patch to the axes' patches; return the patch.
Patch
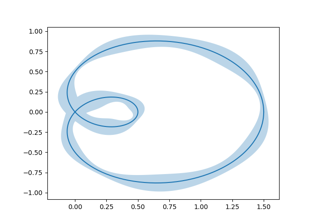
Curve with error band
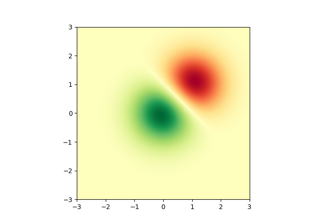
Image Demo
Axes box aspect
Controlling view limits using margins and sticky_edges
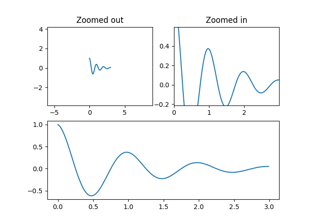
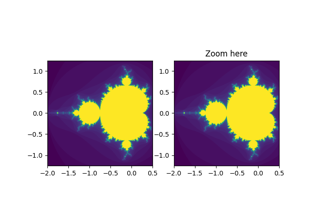
Axes Zoom Effect
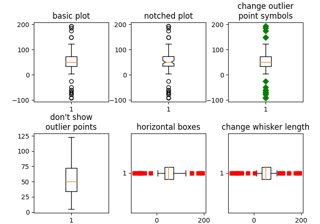
Boxplots
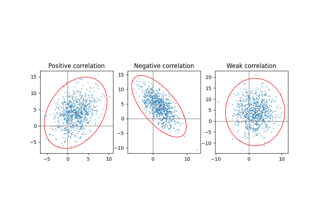
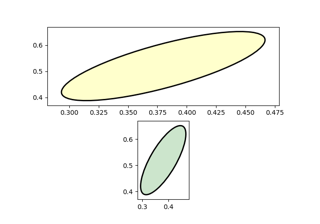
Plot a confidence ellipse of a two-dimensional dataset
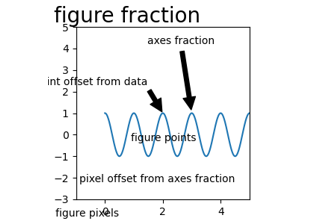
Annotating Plots
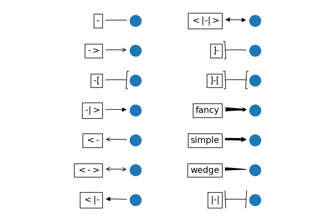
Fancyarrow Demo
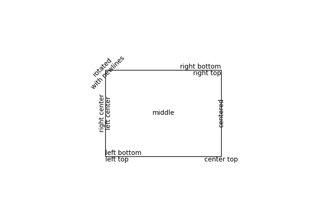
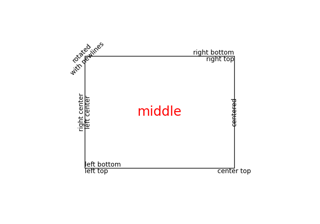
Precise text layout
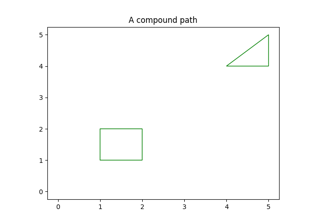
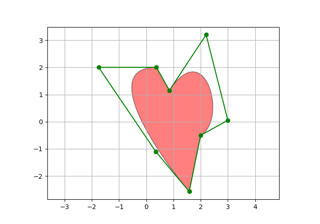
Compound path
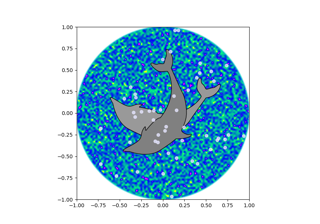
Dolphins
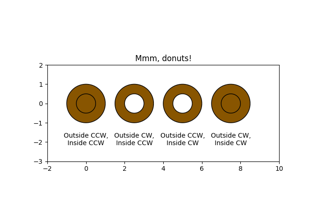
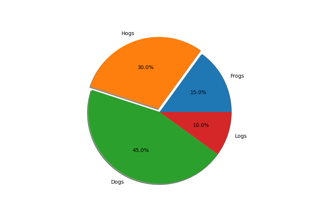
Mmh Donuts!!!
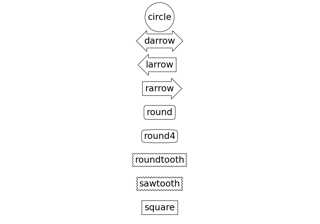
Drawing fancy boxes
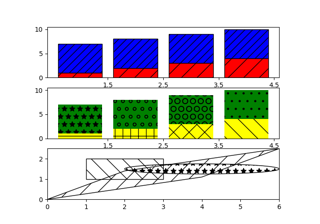
Hatch Demo
PathPatch object
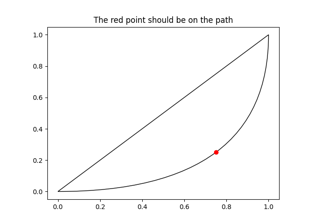
Bezier Curve
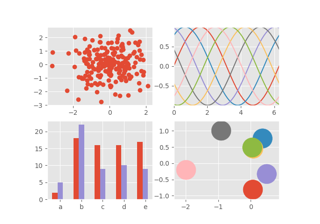
ggplot style sheet
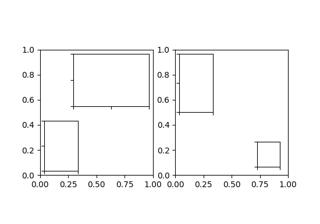
Inset Locator Demo
Firefox
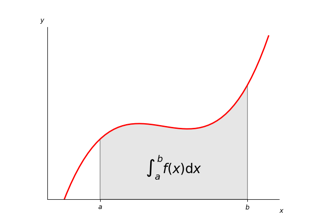
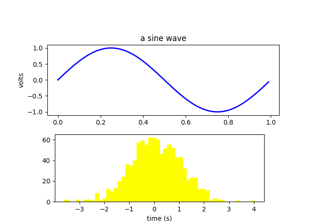
Integral as the area under a curve
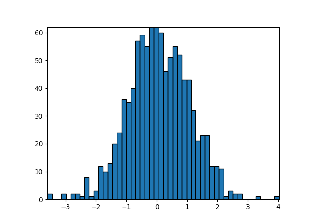
Animated histogram
Looking Glass
Path Editor
Poly Editor
Viewlims
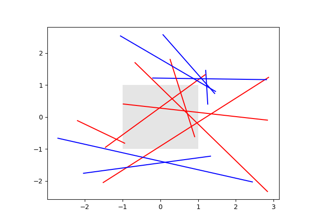
Changing colors of lines intersecting a box
Building histograms using Rectangles and PolyCollections
SVG Filter Pie
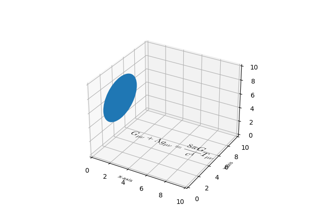
Draw flat objects in 3D plot
Artist tests
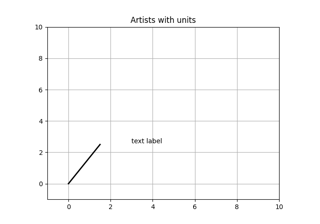
Ellipse With Units
Artist tutorial
Path Tutorial
Transformations Tutorial
Specifying Colors
Text properties and layout