matplotlib.axes
matplotlib.axes.Axes.set_xticks
Axes.
set_xticks
Set the xaxis' tick locations.
List of tick locations.
If False, set the major ticks; if True, the minor ticks.
False
True
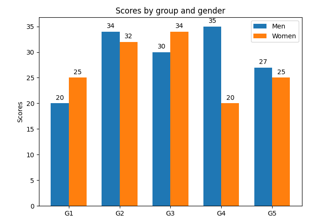
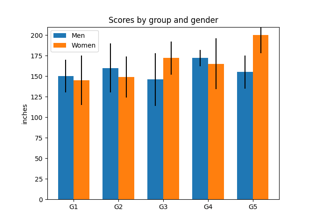
Grouped bar chart with labels
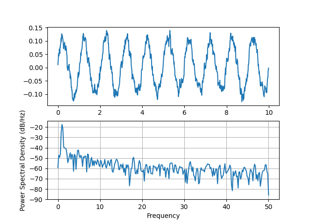
Psd Demo
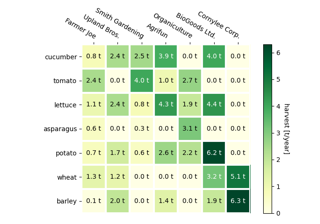
Creating annotated heatmaps
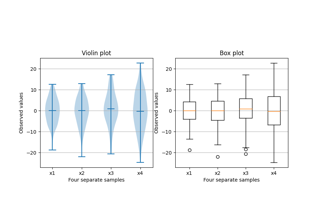
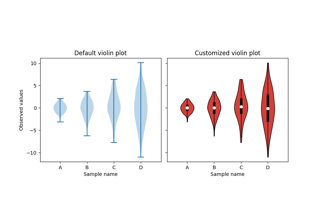
Box plot vs. violin plot comparison
Violin plot customization
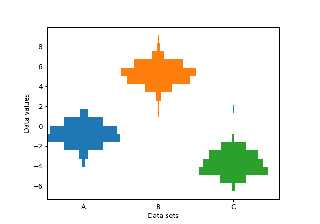
Producing multiple histograms side by side
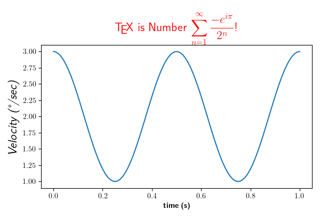
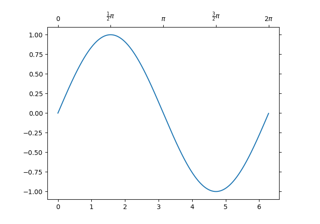
Rendering math equations using TeX
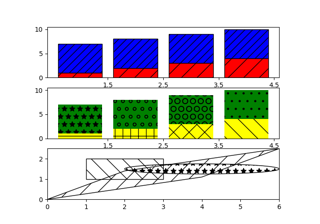
Hatch Demo
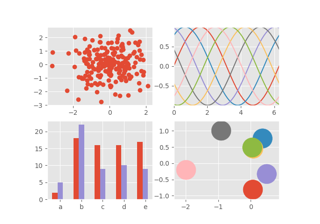
ggplot style sheet
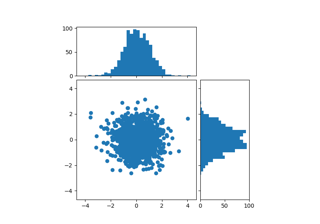
Scatter Histogram (Locatable Axes)
Simple Axisline4
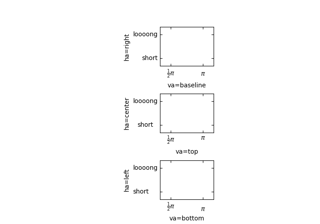
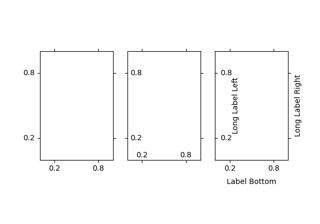
Demo Ticklabel Alignment
Demo Ticklabel Direction
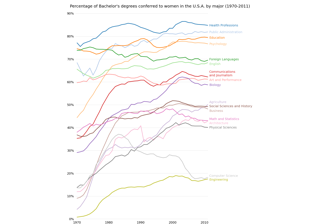
Bachelor's degrees by gender
Firefox
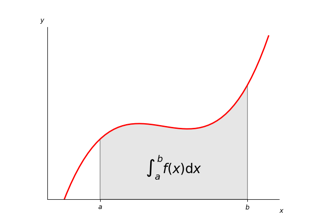
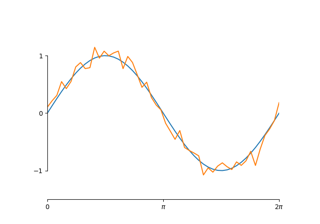
Integral as the area under a curve
Shaded & power normalized rendering
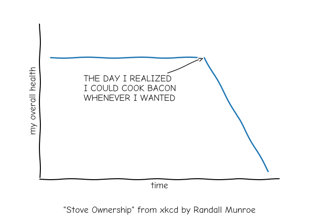
XKCD
Rain simulation
MATPLOTLIB UNCHAINED
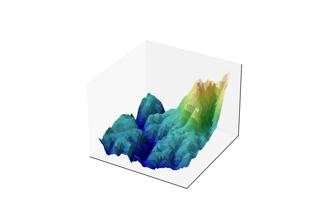
Frontpage 3D example
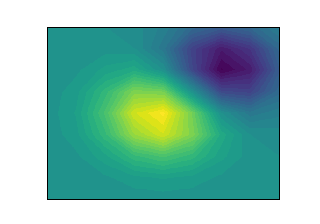
Frontpage contour example
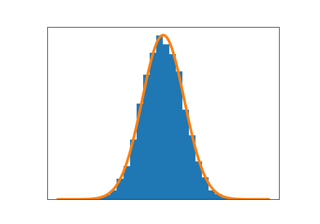
Frontpage histogram example
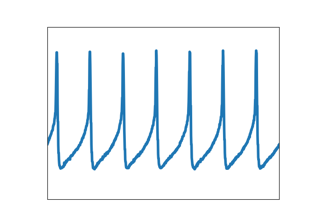
Frontpage plot example
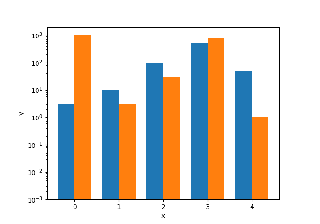
Log Bar
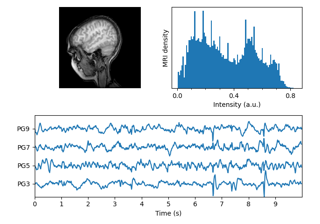
MRI With EEG
Custom spine bounds
Group barchart with units
The Lifecycle of a Plot