matplotlib.axes
matplotlib.axes.Axes.set_yticks
Axes.
set_yticks
Set the yaxis' tick locations.
List of tick locations.
If False, set the major ticks; if True, the minor ticks.
False
True
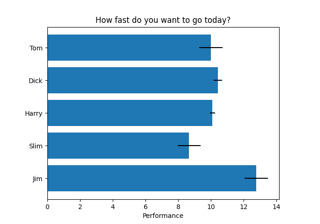
Horizontal bar chart
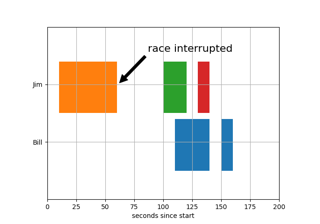
Broken Barh
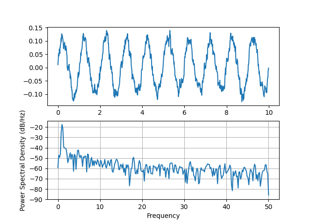
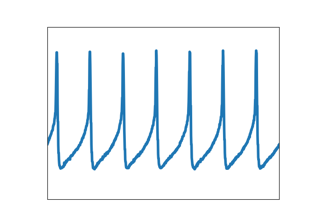
Psd Demo
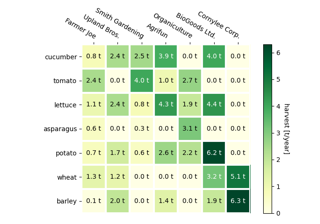
Creating annotated heatmaps
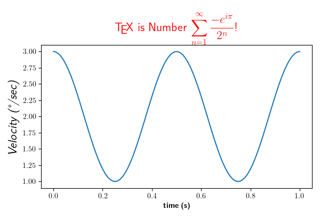
Rendering math equations using TeX
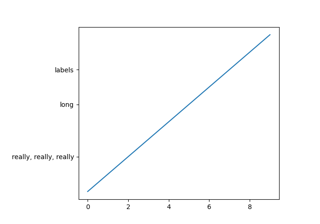
Auto Subplots Adjust
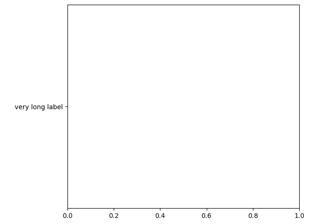
Make Room For Ylabel Using Axesgrid
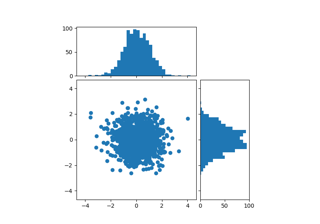
Scatter Histogram (Locatable Axes)
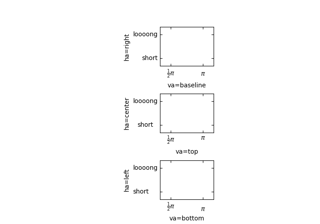
Demo Ticklabel Alignment
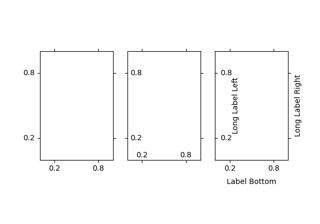
Demo Ticklabel Direction
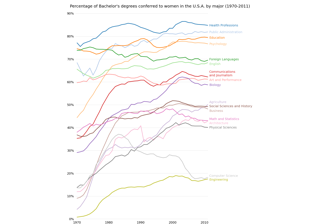
Bachelor's degrees by gender
Firefox
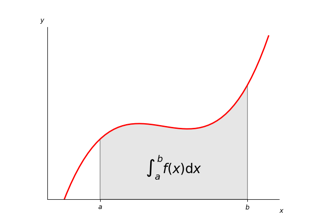
Integral as the area under a curve
Shaded & power normalized rendering
XKCD
Rain simulation
MATPLOTLIB UNCHAINED
Frontpage 3D example
Frontpage contour example
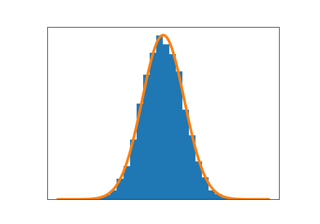
Frontpage histogram example
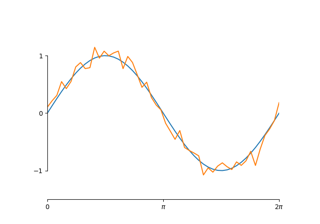
Frontpage plot example
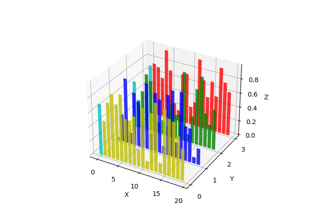
Create 2D bar graphs in different planes
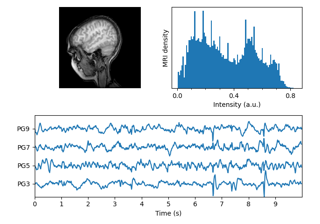
MRI With EEG
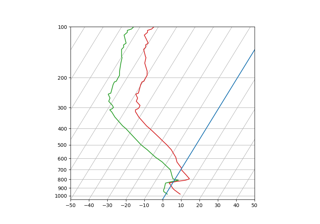
SkewT-logP diagram: using transforms and custom projections
Custom spine bounds