Note
Click here to download the full example code
Demo Axes RGB
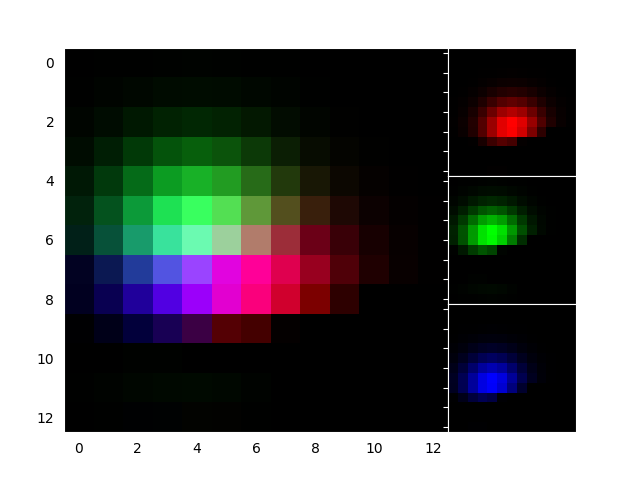
RGBAxes to show RGB composite images.
import numpy as np
from matplotlib import cbook
import matplotlib.pyplot as plt
from mpl_toolkits.axes_grid1.axes_rgb import make_rgb_axes, RGBAxes


def get_rgb():
    Z = cbook.get_sample_data("axes_grid/bivariate_normal.npy", np_load=True)
    Z[Z < 0] = 0.
    Z = Z / Z.max()

    R = Z[:13, :13]
    G = Z[2:, 2:]
    B = Z[:13, 2:]

    return R, G, B


def make_cube(r, g, b):
    ny, nx = r.shape
    R = np.zeros((ny, nx, 3))
    R[:, :, 0] = r
    G = np.zeros_like(R)
    G[:, :, 1] = g
    B = np.zeros_like(R)
    B[:, :, 2] = b

    RGB = R + G + B

    return R, G, B, RGB


def demo_rgb1():
    fig = plt.figure()
    ax = RGBAxes(fig, [0.1, 0.1, 0.8, 0.8], pad=0.0)
    r, g, b = get_rgb()
    ax.imshow_rgb(r, g, b)


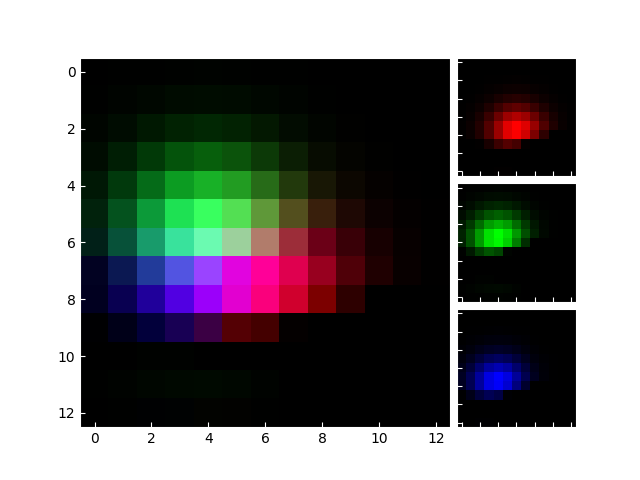
def demo_rgb2():
    fig, ax = plt.subplots()
    ax_r, ax_g, ax_b = make_rgb_axes(ax, pad=0.02)

    r, g, b = get_rgb()
    im_r, im_g, im_b, im_rgb = make_cube(r, g, b)
    ax.imshow(im_rgb)
    ax_r.imshow(im_r)
    ax_g.imshow(im_g)
    ax_b.imshow(im_b)

    for ax in fig.axes:
        ax.tick_params(axis='both', direction='in')
        for sp1 in ax.spines.values():
            sp1.set_color("w")
        for tick in ax.xaxis.get_major_ticks() + ax.yaxis.get_major_ticks():
            tick.tick1line.set_markeredgecolor("w")
            tick.tick2line.set_markeredgecolor("w")


demo_rgb1()
demo_rgb2()

plt.show()
Keywords: matplotlib code example, codex, python plot, pyplot Gallery generated by Sphinx-Gallery

