Note
Click here to download the full example code
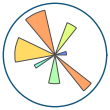
Matplotlib logo
This example generates the current matplotlib logo.
import numpy as np
import matplotlib.pyplot as plt
import matplotlib.cm as cm
import matplotlib.font_manager
from matplotlib.patches import Rectangle, PathPatch
from matplotlib.textpath import TextPath
import matplotlib.transforms as mtrans

MPL_BLUE = '#11557c'


def get_font_properties():
    # The original font is Calibri, if that is not installed, we fall back
    # to Carlito, which is metrically equivalent.
    if 'Calibri' in matplotlib.font_manager.findfont('Calibri:bold'):
        return matplotlib.font_manager.FontProperties(family='Calibri',
                                                      weight='bold')
    if 'Carlito' in matplotlib.font_manager.findfont('Carlito:bold'):
        print('Original font not found. Falling back to Carlito. '
              'The logo text will not be in the correct font.')
        return matplotlib.font_manager.FontProperties(family='Carlito',
                                                      weight='bold')
    print('Original font not found. '
          'The logo text will not be in the correct font.')
    return None


def create_icon_axes(fig, ax_position, lw_bars, lw_grid, lw_border, rgrid):
    """
    Create a polar axes containing the matplotlib radar plot.

    Parameters
    ----------
    fig : matplotlib.figure.Figure
        The figure to draw into.
    ax_position : (float, float, float, float)
        The position of the created Axes in figure coordinates as
        (x, y, width, height).
    lw_bars : float
        The linewidth of the bars.
    lw_grid : float
        The linewidth of the grid.
    lw_border : float
        The linewidth of the Axes border.
    rgrid : array-like
        Positions of the radial grid.

    Returns
    -------
    ax : matplotlib.axes.Axes
        The created Axes.
    """
    with plt.rc_context({'axes.edgecolor': MPL_BLUE,
                         'axes.linewidth': lw_border}):
        ax = fig.add_axes(ax_position, projection='polar')
        ax.set_axisbelow(True)

        N = 7
        arc = 2. * np.pi
        theta = np.arange(0.0, arc, arc / N)
        radii = np.array([2, 6, 8, 7, 4, 5, 8])
        width = np.pi / 4 * np.array([0.4, 0.4, 0.6, 0.8, 0.2, 0.5, 0.3])
        bars = ax.bar(theta, radii, width=width, bottom=0.0, align='edge',
                      edgecolor='0.3', lw=lw_bars)
        for r, bar in zip(radii, bars):
            color = *cm.jet(r / 10.)[:3], 0.6  # color from jet with alpha=0.6
            bar.set_facecolor(color)

        ax.tick_params(labelbottom=False, labeltop=False,
                       labelleft=False, labelright=False)

        ax.grid(lw=lw_grid, color='0.9')
        ax.set_rmax(9)
        ax.set_yticks(rgrid)

        # the actual visible background - extends a bit beyond the axis
        ax.add_patch(Rectangle((0, 0), arc, 9.58,
                               facecolor='white', zorder=0,
                               clip_on=False, in_layout=False))
        return ax


def create_text_axes(fig, height_px):
    """Create an axes in *fig* that contains 'matplotlib' as Text."""
    ax = fig.add_axes((0, 0, 1, 1))
    ax.set_aspect("equal")
    ax.set_axis_off()

    path = TextPath((0, 0), "matplotlib", size=height_px * 0.8,
                    prop=get_font_properties())

    angle = 4.25  # degrees
    trans = mtrans.Affine2D().skew_deg(angle, 0)

    patch = PathPatch(path, transform=trans + ax.transData, color=MPL_BLUE,
                      lw=0)
    ax.add_patch(patch)
    ax.autoscale()


def make_logo(height_px, lw_bars, lw_grid, lw_border, rgrid, with_text=False):
    """
    Create a full figure with the Matplotlib logo.

    Parameters
    ----------
    height_px : int
        Height of the figure in pixel.
    lw_bars : float
        The linewidth of the bar border.
    lw_grid : float
        The linewidth of the grid.
    lw_border : float
        The linewidth of icon border.
    rgrid : sequence of float
        The radial grid positions.
    with_text : bool
        Whether to draw only the icon or to include 'matplotlib' as text.
    """
    dpi = 100
    height = height_px / dpi
    figsize = (5 * height, height) if with_text else (height, height)
    fig = plt.figure(figsize=figsize, dpi=dpi)
    fig.patch.set_alpha(0)

    if with_text:
        create_text_axes(fig, height_px)
    ax_pos = (0.535, 0.12, .17, 0.75) if with_text else (0.03, 0.03, .94, .94)
    ax = create_icon_axes(fig, ax_pos, lw_bars, lw_grid, lw_border, rgrid)

    return fig, ax
A large logo:
make_logo(height_px=110, lw_bars=0.7, lw_grid=0.5, lw_border=1,
          rgrid=[1, 3, 5, 7])
Out:
(<Figure size 110x110 with 1 Axes>, <matplotlib.projections.polar.PolarAxes object at 0x7fba1fce57f0>)
A small 32px logo:
make_logo(height_px=32, lw_bars=0.3, lw_grid=0.3, lw_border=0.3, rgrid=[5])

Out:
(<Figure size 32x32 with 1 Axes>, <matplotlib.projections.polar.PolarAxes object at 0x7fba22241a00>)
A large logo including text, as used on the matplotlib website.
make_logo(height_px=110, lw_bars=0.7, lw_grid=0.5, lw_border=1,
          rgrid=[1, 3, 5, 7], with_text=True)
plt.show()

Out:
findfont: Font family ['Calibri'] not found. Falling back to DejaVu Sans.
Original font not found. Falling back to Carlito. The logo text will not be in the correct font.
Keywords: matplotlib code example, codex, python plot, pyplot Gallery generated by Sphinx-Gallery