Note
Click here to download the full example code
3D plots as subplots
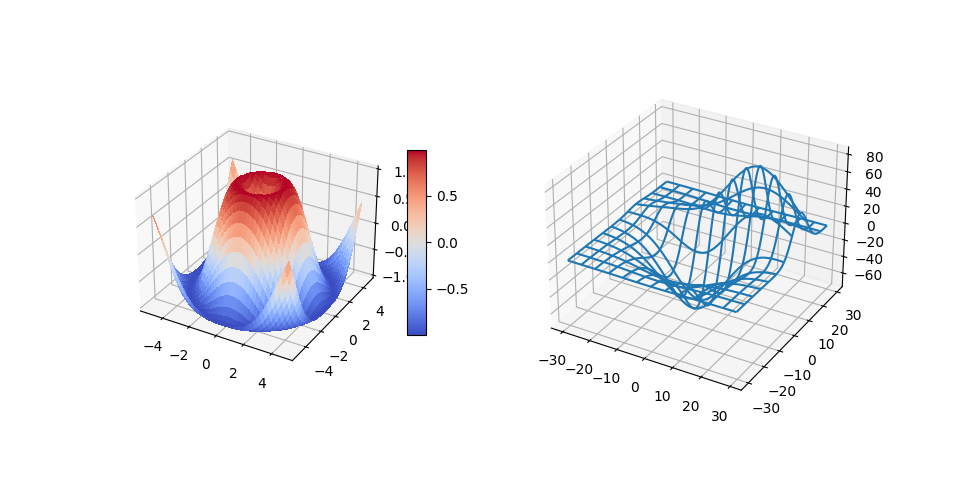
Demonstrate including 3D plots as subplots.

import matplotlib.pyplot as plt
from matplotlib import cm
import numpy as np

from mpl_toolkits.mplot3d.axes3d import get_test_data


# set up a figure twice as wide as it is tall
fig = plt.figure(figsize=plt.figaspect(0.5))

#===============
#  First subplot
#===============
# set up the axes for the first plot
ax = fig.add_subplot(1, 2, 1, projection='3d')

# plot a 3D surface like in the example mplot3d/surface3d_demo
X = np.arange(-5, 5, 0.25)
Y = np.arange(-5, 5, 0.25)
X, Y = np.meshgrid(X, Y)
R = np.sqrt(X**2 + Y**2)
Z = np.sin(R)
surf = ax.plot_surface(X, Y, Z, rstride=1, cstride=1, cmap=cm.coolwarm,
                       linewidth=0, antialiased=False)
ax.set_zlim(-1.01, 1.01)
fig.colorbar(surf, shrink=0.5, aspect=10)

#===============
# Second subplot
#===============
# set up the axes for the second plot
ax = fig.add_subplot(1, 2, 2, projection='3d')

# plot a 3D wireframe like in the example mplot3d/wire3d_demo
X, Y, Z = get_test_data(0.05)
ax.plot_wireframe(X, Y, Z, rstride=10, cstride=10)

plt.show()
Keywords: matplotlib code example, codex, python plot, pyplot Gallery generated by Sphinx-Gallery