New in matplotlib 1.0
Table of Contents
HTML5/Canvas backend
Simon Ratcliffe and Ludwig Schwardt have released an HTML5/Canvas backend for matplotlib. The backend is almost feature complete, and they have done a lot of work comparing their html5 rendered images with our core renderer Agg. The backend features client/server interactive navigation of matplotlib figures in an html5 compliant browser.
Sophisticated subplot grid layout
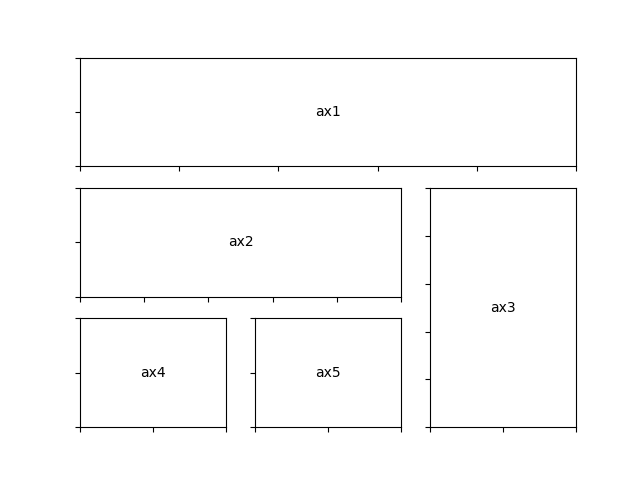
Jae-Joon Lee has written gridspec, a new module for
doing complex subplot layouts, featuring row and column spans and
more. See Customizing Figure Layouts Using GridSpec and Other Functions for a tutorial overview.

Demo Gridspec01
Easy pythonic subplots
Fernando Perez got tired of all the boilerplate code needed to create a
figure and multiple subplots when using the matplotlib API, and wrote
a subplots() helper function. Basic usage
allows you to create the figure and an array of subplots with numpy
indexing (starts with 0). e.g.:
fig, axarr = plt.subplots(2, 2)
axarr[0,0].plot([1,2,3])   # upper, left
See Basic Subplot Demo for several code examples.
Contour fixes and and triplot
Ian Thomas has fixed a long-standing bug that has vexed our most
talented developers for years. contourf()
now handles interior masked regions, and the boundaries of line and
filled contours coincide.
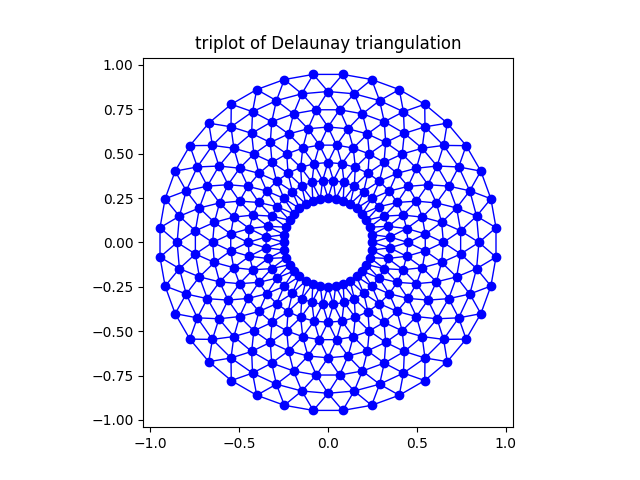
Additionally, he has contributed a new module tri and
helper function triplot() for creating and
plotting unstructured triangular grids.

Triplot Demo
multiple calls to show supported
A long standing request is to support multiple calls to
show(). This has been difficult because it
is hard to get consistent behavior across operating systems, user
interface toolkits and versions. Eric Firing has done a lot of work
on rationalizing show across backends, with the desired behavior to
make show raise all newly created figures and block execution until
they are closed. Repeated calls to show should raise newly created
figures since the last call. Eric has done a lot of testing on the
user interface toolkits and versions and platforms he has access to,
but it is not possible to test them all, so please report problems to
the mailing list
and bug tracker.
mplot3d graphs can be embedded in arbitrary axes
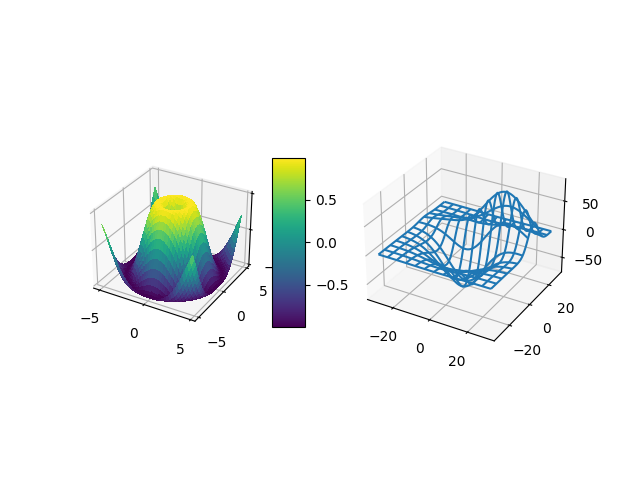
You can now place an mplot3d graph into an arbitrary axes location, supporting mixing of 2D and 3D graphs in the same figure, and/or multiple 3D graphs in a single figure, using the "projection" keyword argument to add_axes or add_subplot. Thanks Ben Root.

What's New 1 Subplot3d
tick_params
Eric Firing wrote tick_params, a convenience method for changing the
appearance of ticks and tick labels. See pyplot function
tick_params() and associated Axes method
tick_params().
Lots of performance and feature enhancements
- Faster magnification of large images, and the ability to zoom in to a single pixel
- Local installs of documentation work better
- Improved "widgets" -- mouse grabbing is supported
- More accurate snapping of lines to pixel boundaries
- More consistent handling of color, particularly the alpha channel, throughout the API
Much improved software carpentry
The matplotlib trunk is probably in as good a shape as it has ever been, thanks to improved software carpentry. We now have a buildbot which runs a suite of nose regression tests on every svn commit, auto-generating a set of images and comparing them against a set of known-goods, sending emails to developers on failures with a pixel-by-pixel image comparison. Releases and release bugfixes happen in branches, allowing active new feature development to happen in the trunk while keeping the release branches stable. Thanks to Andrew Straw, Michael Droettboom and other matplotlib developers for the heavy lifting.
Bugfix marathon
Eric Firing went on a bug fixing and closing marathon, closing over 100 bugs on the (now-closed) SourceForge bug tracker with help from Jae-Joon Lee, Michael Droettboom, Christoph Gohlke and Michiel de Hoon.