matplotlib.axes.Axes.bar
-
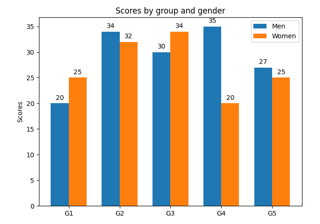
Axes.bar(self, x, height, width=0.8, bottom=None, *, align='center', data=None, **kwargs)[source]¶ Make a bar plot.
The bars are positioned at x with the given alignment. Their dimensions are given by height and width. The vertical baseline is bottom (default 0).
Many parameters can take either a single value applying to all bars or a sequence of values, one for each bar.
Parameters: - xfloat or array-like
The x coordinates of the bars. See also align for the alignment of the bars to the coordinates.
- heightfloat or array-like
The height(s) of the bars.
- widthfloat or array-like, default: 0.8
The width(s) of the bars.
- bottomfloat or array-like, default: 0
The y coordinate(s) of the bars bases.
- align{'center', 'edge'}, default: 'center'
Alignment of the bars to the x coordinates:
- 'center': Center the base on the x positions.
- 'edge': Align the left edges of the bars with the x positions.
To align the bars on the right edge pass a negative width and
align='edge'.
Returns: BarContainerContainer with all the bars and optionally errorbars.
Other Parameters: - colorcolor or list of color, optional
The colors of the bar faces.
- edgecolorcolor or list of color, optional
The colors of the bar edges.
- linewidthfloat or array-like, optional
Width of the bar edge(s). If 0, don't draw edges.
- tick_labelstr or list of str, optional
The tick labels of the bars. Default: None (Use default numeric labels.)
- xerr, yerrfloat or array-like of shape(N,) or shape(2, N), optional
If not None, add horizontal / vertical errorbars to the bar tips. The values are +/- sizes relative to the data:
- scalar: symmetric +/- values for all bars
- shape(N,): symmetric +/- values for each bar
- shape(2, N): Separate - and + values for each bar. First row contains the lower errors, the second row contains the upper errors.
- None: No errorbar. (Default)
See Different ways of specifying error bars for an example on the usage of
xerrandyerr.- ecolorcolor or list of color, default: 'black'
The line color of the errorbars.
- capsizefloat, default:
rcParams["errorbar.capsize"](default:0.0) The length of the error bar caps in points.
- error_kwdict, optional
Dictionary of kwargs to be passed to the
errorbarmethod. Values of ecolor or capsize defined here take precedence over the independent kwargs.- logbool, default: False
If True, set the y-axis to be log scale.
- **kwargs
Rectangleproperties Property Description agg_filtera filter function, which takes a (m, n, 3) float array and a dpi value, and returns a (m, n, 3) array alphafloat or None animatedbool antialiasedor aaunknown capstyle{'butt', 'round', 'projecting'} clip_boxBboxclip_onbool clip_pathPatch or (Path, Transform) or None colorcolor containsunknown edgecoloror eccolor or None or 'auto' facecoloror fccolor or None figureFigurefillbool gidstr hatch{'/', '\', '|', '-', '+', 'x', 'o', 'O', '.', '*'} in_layoutbool joinstyle{'miter', 'round', 'bevel'} labelobject linestyleor ls{'-', '--', '-.', ':', '', (offset, on-off-seq), ...} linewidthor lwfloat or None path_effectsAbstractPathEffectpickerNone or bool or callable rasterizedbool or None sketch_params(scale: float, length: float, randomness: float) snapbool or None transformTransformurlstr visiblebool zorderfloat
See also
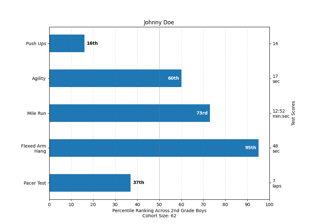
barh- Plot a horizontal bar plot.
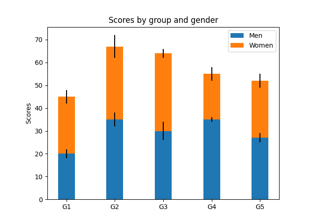
Notes
Stacked bars can be achieved by passing individual bottom values per bar. See Stacked bar chart.
Note
In addition to the above described arguments, this function can take a data keyword argument. If such a data argument is given, every other argument can also be string
s, which is interpreted asdata[s](unless this raises an exception).Objects passed as data must support item access (
data[s]) and membership test (s in data).