Comparison with constrained_layout
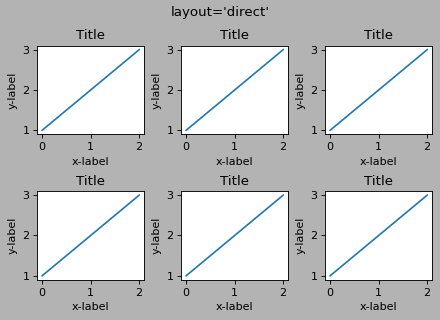
This page shows layout='direct' compared side-by-side with Matplotlib’s
built-in layout='constrained' to demonstrate similar behavior.
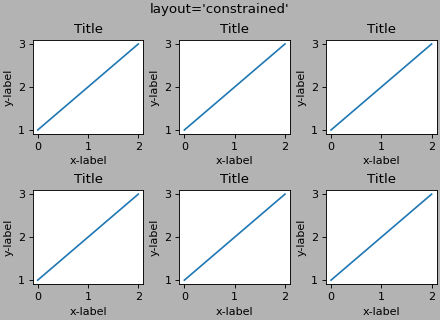
Basic grid
Both engines handle basic subplot grids with labels and titles:
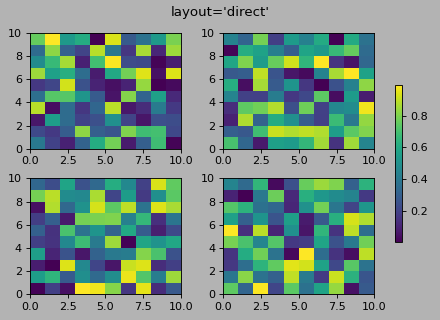
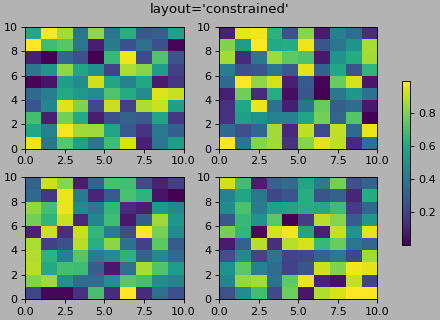
Shared colorbar
Both engines support shared colorbars across multiple axes:
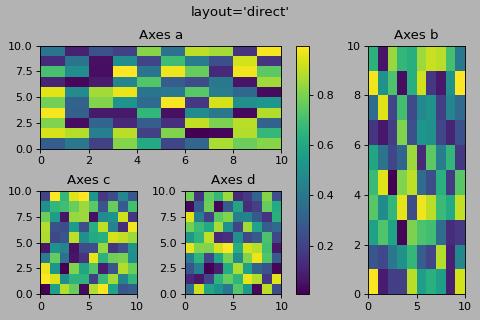
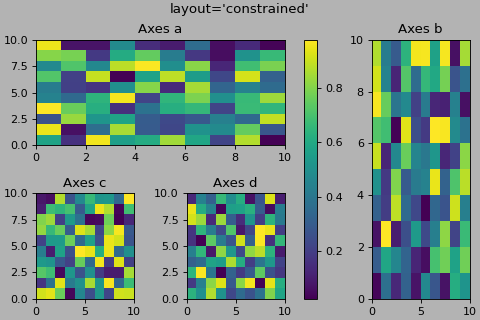
Mosaic layout
Complex mosaic layouts with shared colorbars:
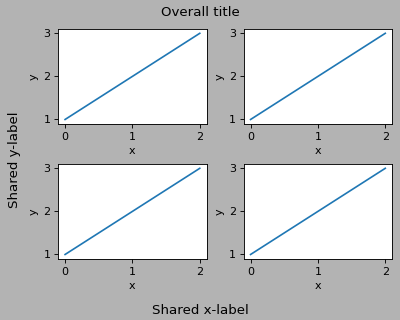
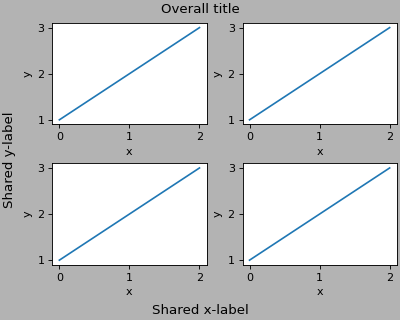
Super-labels
Both engines handle suptitle, supxlabel, and supylabel:
Key Differences
- Performance:
directuses only NumPy arithmeticconstraineduses the kiwisolver constraint solver
- Dependencies:
directrequires only NumPy (already required by Matplotlib)constrainedrequires the additionalkiwisolverpackage
- Tuning:
directuses physical units (inches) for margins and paddingconstraineduses relative units and heuristics
- Use Cases:
directis ideal when you want precise control over spacing in physical unitsconstrainedmay handle more complex edge cases and has years of production use
Performance
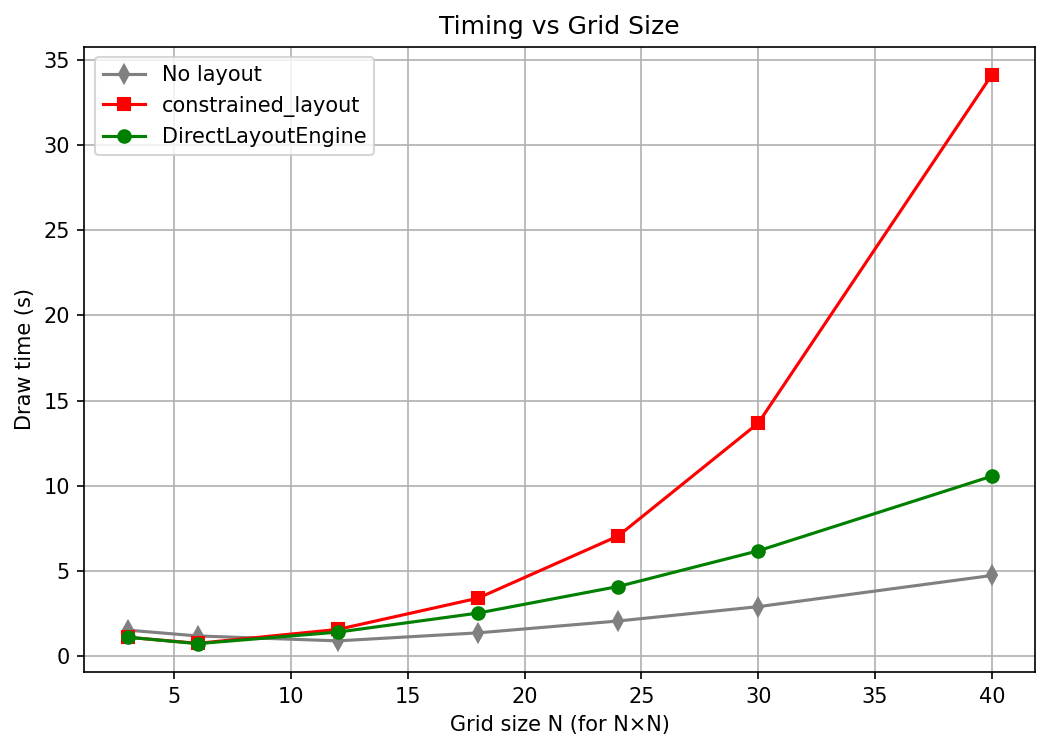
Timing and peak memory usage for DirectLayoutEngine vs constrained_layout on grids up to 30×30 axes. (See benchmark_timing_memory.txt for system details.)
The plot above was generated using the benchmark script in the repository. For reproducibility, system and environment details are saved in benchmark_timing_memory.txt:
Generated on: 2026-03-15 21:00:11
System: Darwin 25.2.0 (arm64)
Processor: arm
Python: 3.11.14
Matplotlib: 3.11.0.dev1937+g32805b179
Note
The benchmark is not run as part of the documentation build, to avoid long runtimes. The image and system info are static outputs from a single run.